Method 1 – Analyze qPCR Data Through Double Delta Ct Method
Steps:
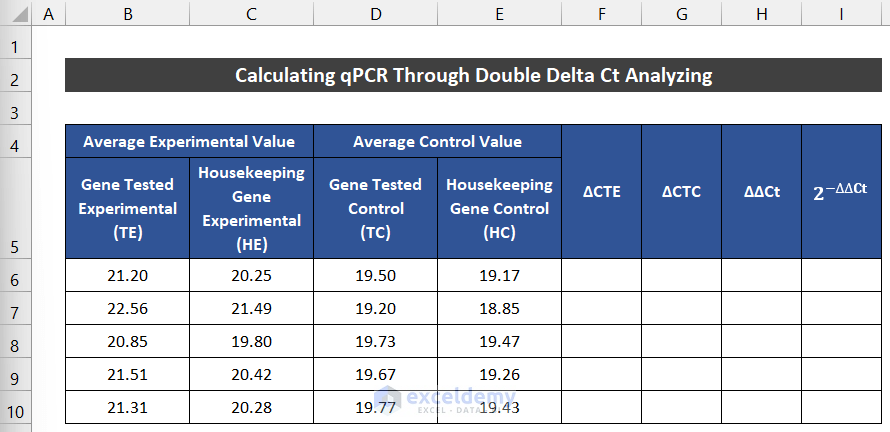
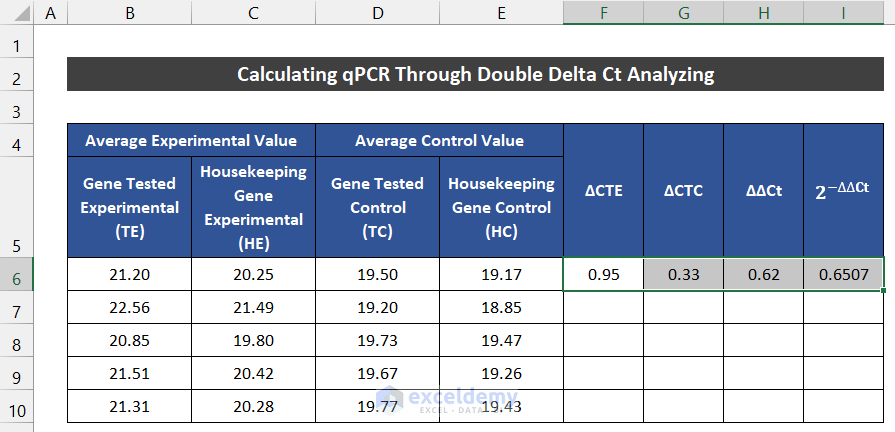
- Input all the gene values accurately as shown in the image. We have to input all the experimental values of Gene Tested Experimental(TE) and Housekeeping Gene Experimental(HE) in columns B and C. Input all the control values of Gene Tested Control(TC) and Housekeeping Gene Control(HC) in columns D and E.
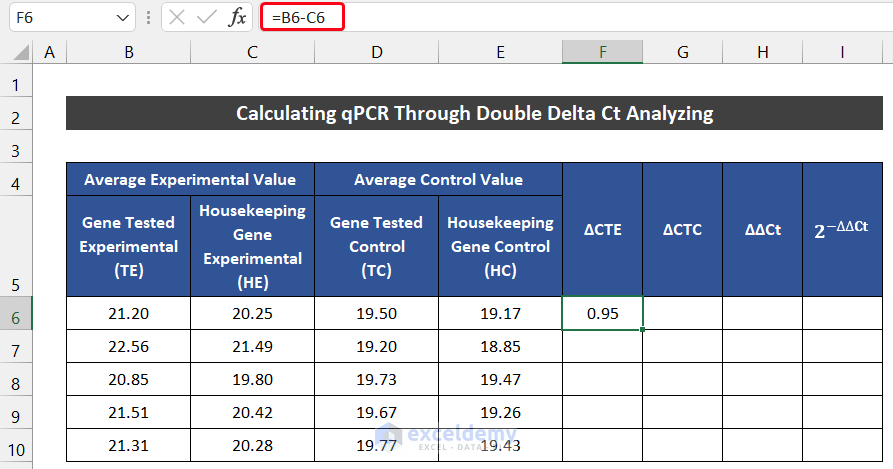
- To calculate the value of ∆CTE, in cell F5, enter the following formula.
=B6-C6
- Press Enter.
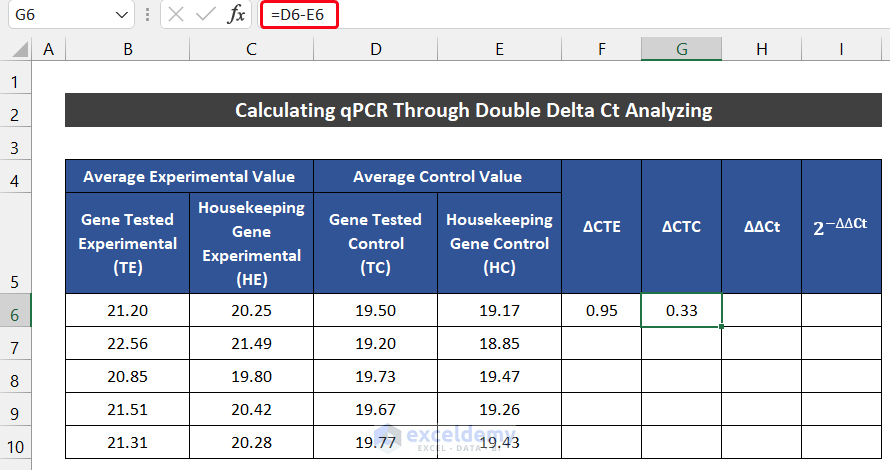
- To estimate the value of ∆CTC, enter the following formula in cell G5.
=D6-E6
- Press Enter.
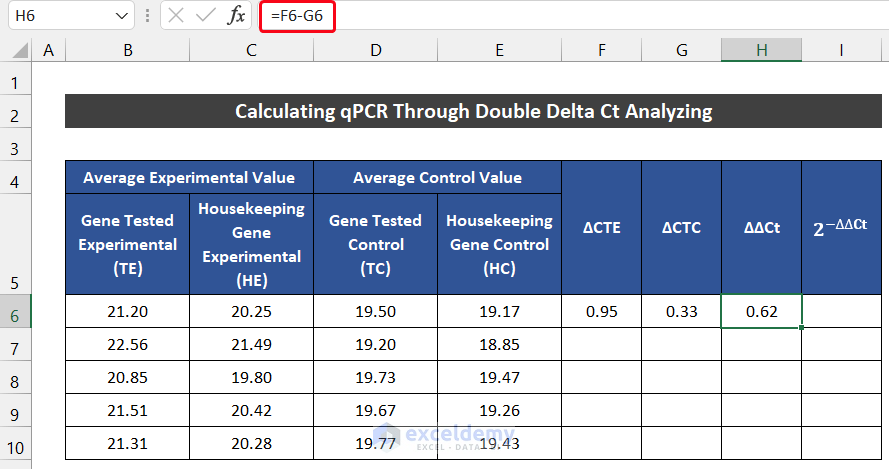
- Select cell H5 and enter the following formula to get the value of ∆∆Ct.
=F6-G6
- Press Enter.
- To calculate the value of the Gene Expression Ratio or 2^(−∆∆Ct), enter the following formula in cell I5.
=2^(-H6)
- Press Enter.

- Select the range of cell F6:I6.
- Double-click on the Fill Handle icon to fill the formula up to row 10.
- You will get the values of the Gene Expression Ratio for every sample.

Interpretation of the Result
The value of the Gene Expression Ratio of 0.6507 in cell I5 means the gene samples in the tested conditions with respect to the control conditions all have been normalized to our housekeeping gene. You can consider it in the percentage term. 0.6507 means 65.07% gene expression in our tested condition with our control condition.
Method 2 – Analyze qPCR Using Pfaffl Method
Steps:
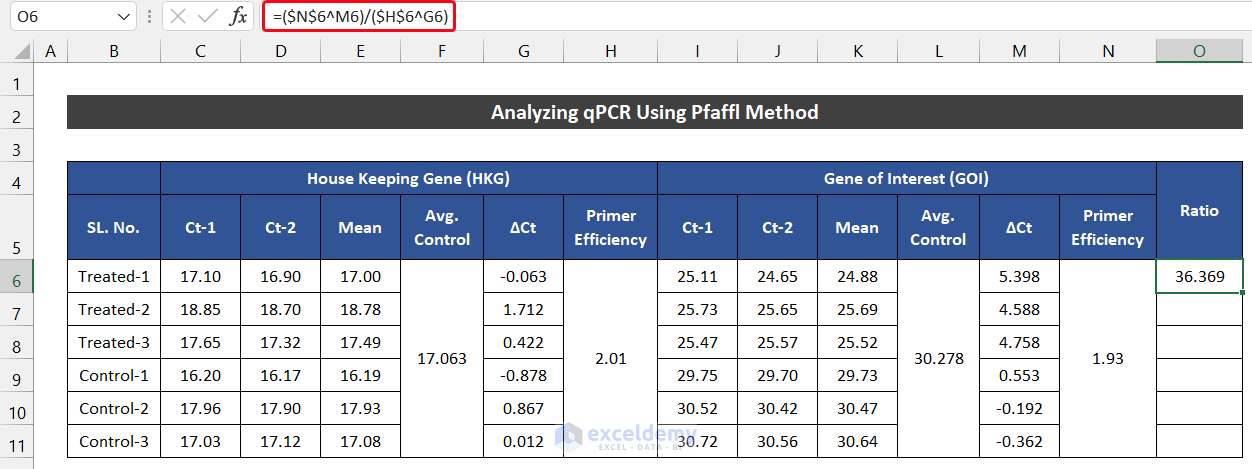
- Input all the gene values accurately, as shown in the image. We have to input all the two sets of treated and control gene values of House Keeping Gene (HKG) and Gene of Interest (GOI). Both gene sets are denoted Ct-1 and Ct-2.
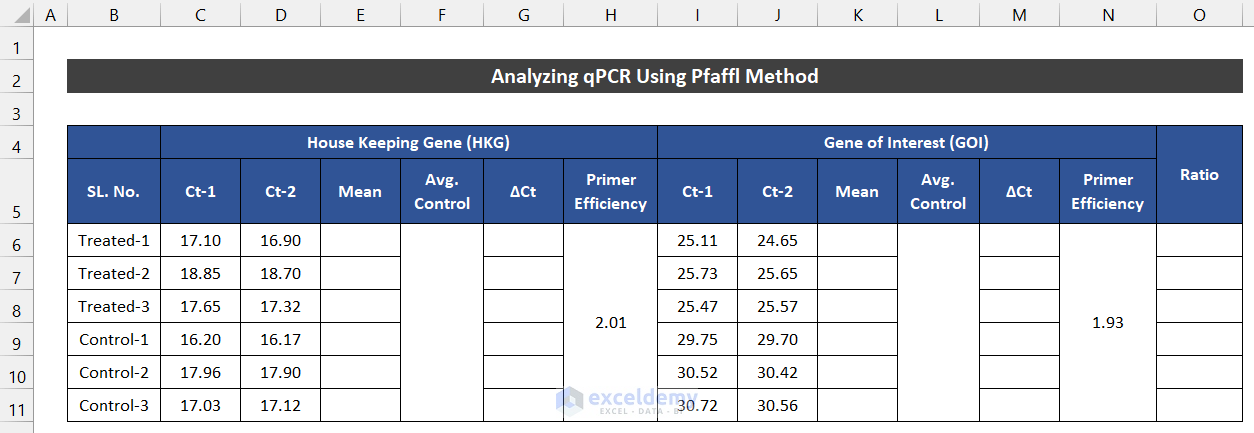
- Complete all the calculations for the House Keeping Gene (HKG)
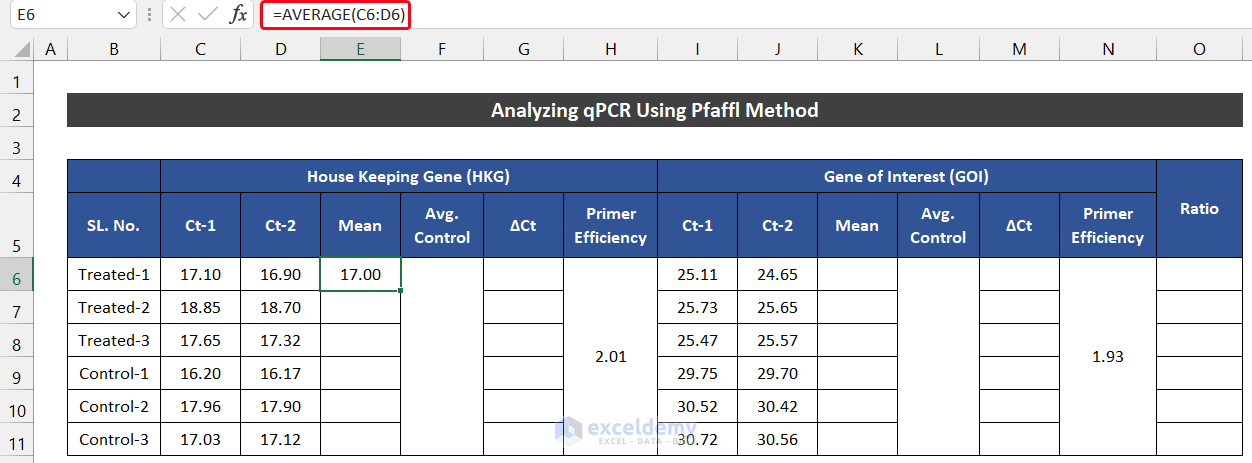
- Take the mean value of both sets. For that, we are going to use the AVERAGE function.
- Enter the following formula in cell E6.
=AVERAGE(C6:D6)
- Press Enter.
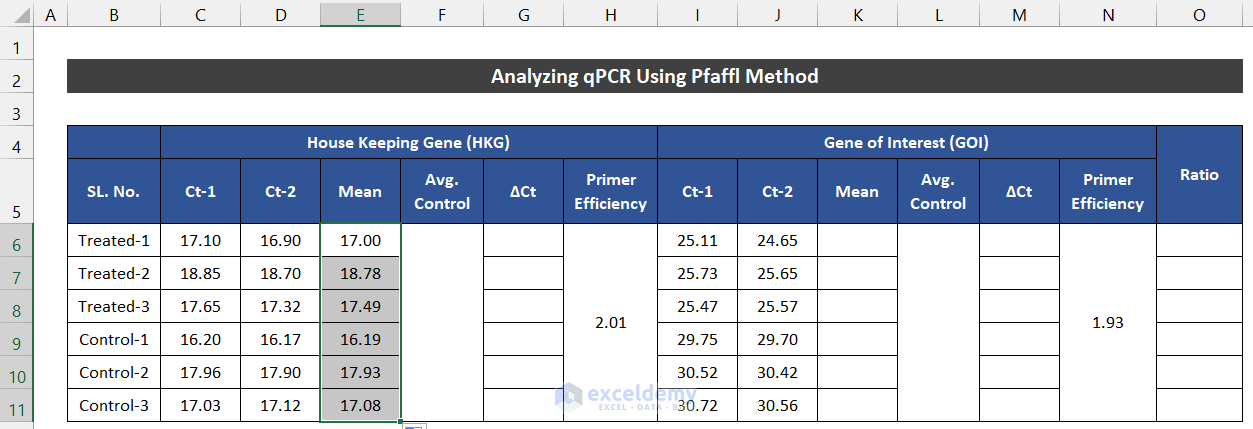
- Double-click on the Fill Handle icon to fill the formula up to cell E11.
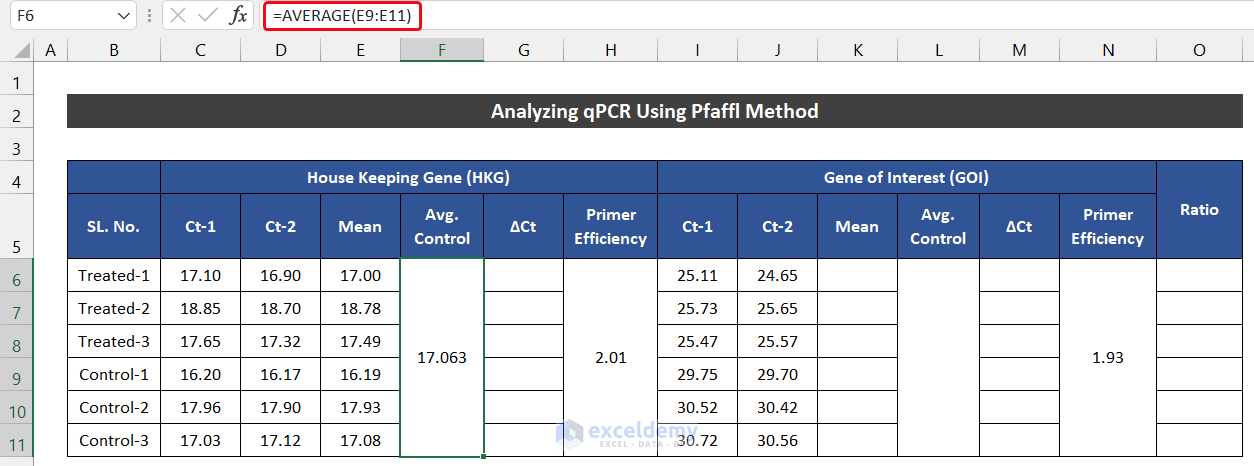
- Estimate the average of the three control values.
- Enter the following formula in the merged F6.
=AVERAGE(E9:E11)
- Press Enter.
- Select cell G6 and enter the following formula to get the value of ∆Ct. Input the Absolute Cell Reference for cell F6.
=E6-$F$6
- Press Enter.
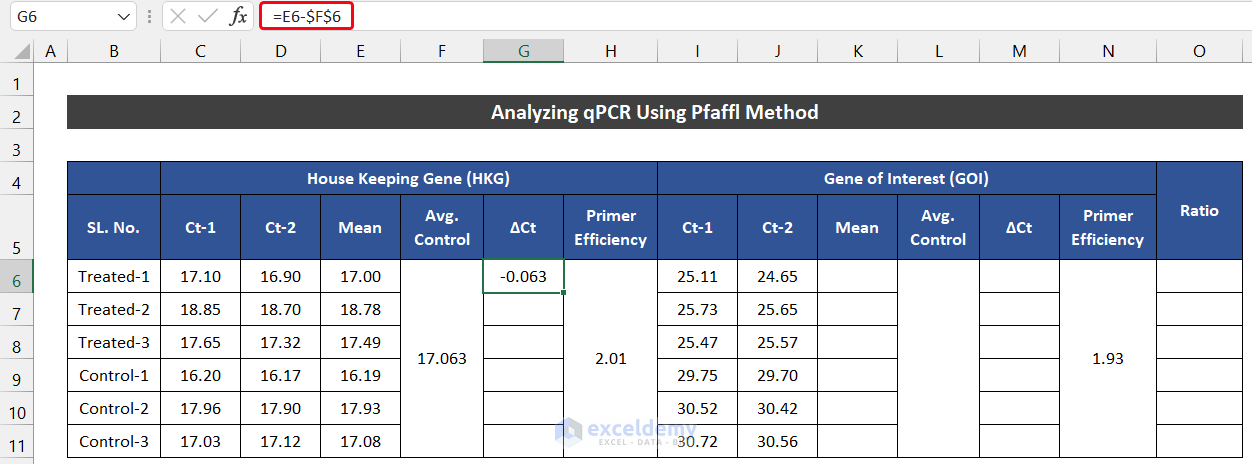
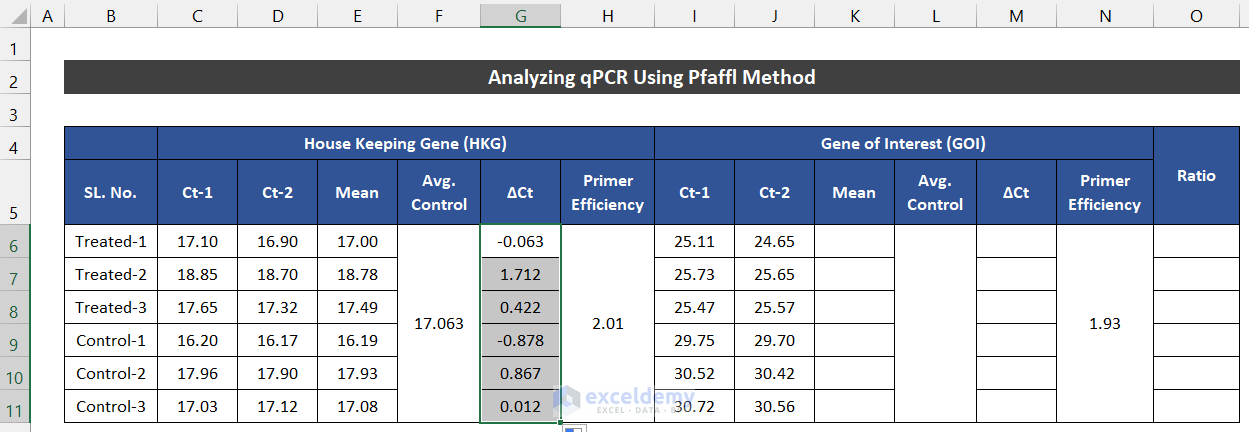
- Double-click on the Fill Handle icon to fill the formula up to cell G11.
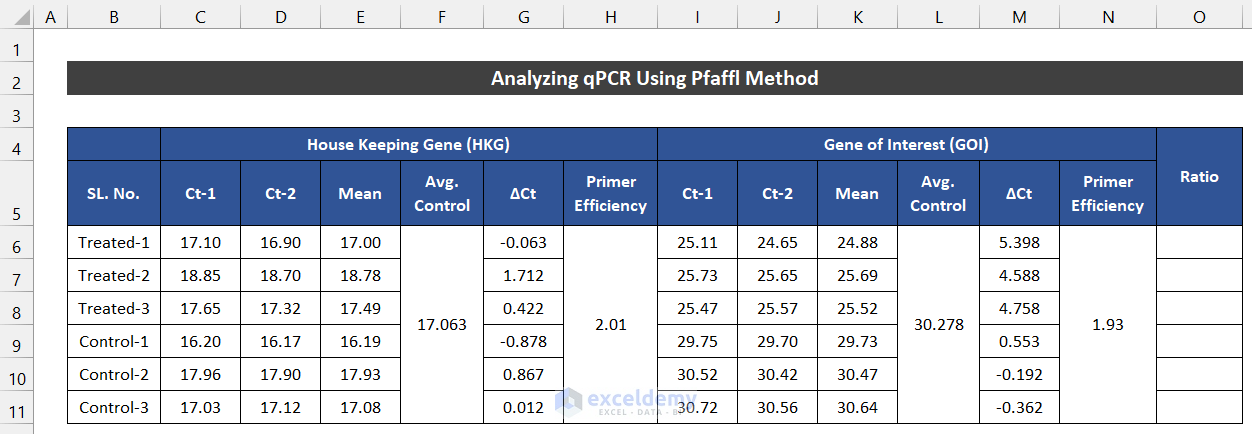
- Follow the same process complete all the calculations for the Gene of Interest (GOI) section.
- In cell O6, enter the following formula to get the value of the expression ratio. Ensure the Absolute Cell Reference for cells N6 and H6.
=($N$6^M6)/($H$6^G6)
- Press Enter.
- Double-click on the Fill Handle icon to fill the formula up to cell O11.
- You will get the values of the expression ratio for every sample.

Read More: How to Analyze Large Data Sets in Excel
Download Practice Workbook
Related Articles
- How to Analyze Raw Data in Excel
- How to Analyze Text Data in Excel
- How to Analyze Time Series Data in Excel
- How to Analyze Sales Data in Excel
- How to Analyze Likert Scale Data in Excel
- How to Analyze Quantitative Data in Excel
- How to Analyze Qualitative Data in Excel
- How to Analyse Qualitative Data from a Questionnaire in Excel
- How to Convert Qualitative Data to Quantitative Data in Excel
<< Go Back to Data Analysis with Excel | Learn Excel
Get FREE Advanced Excel Exercises with Solutions!
