What Is Data Analysis Toolpak?
Data Analysis Toolpak is an Add-Ins in Excel which is essential to enable Data Analysis.
Steps to Install Data Analysis Toolpak in Excel
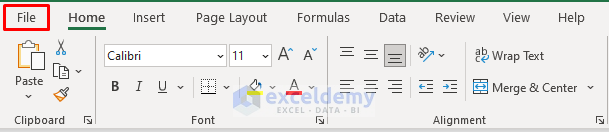
Step 1: Go to the File tab.
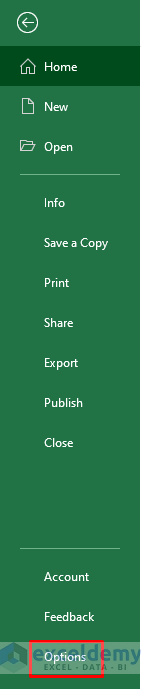
Step 2: Select Options from the list.
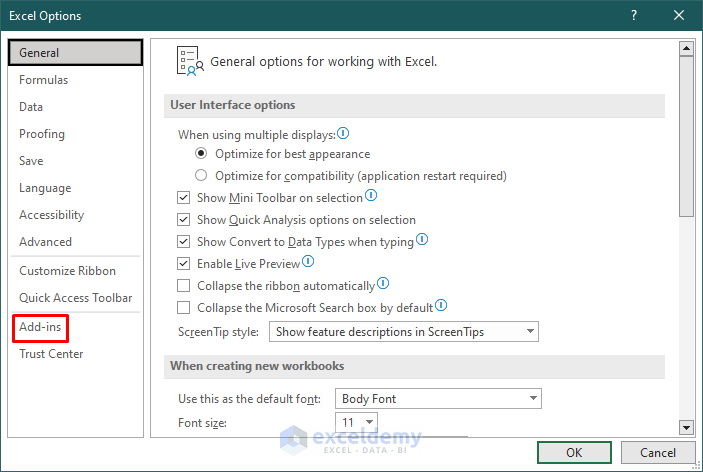
Step 3: In the Excel Options window, select Add-Ins.
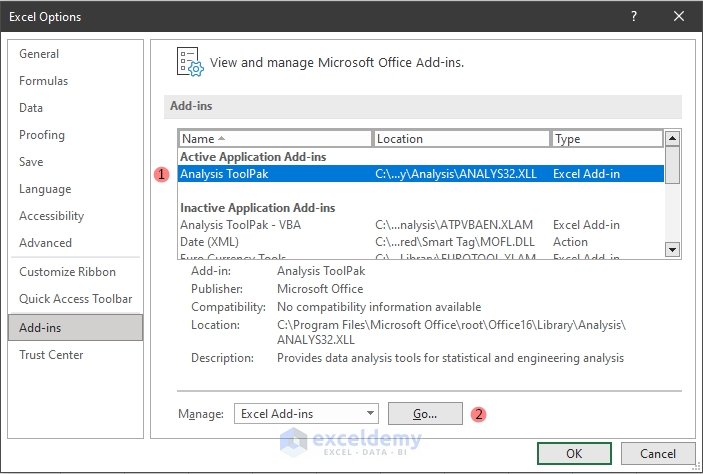
Step 4: From the Add-ins list, select Analysis Toolpak and click Go.
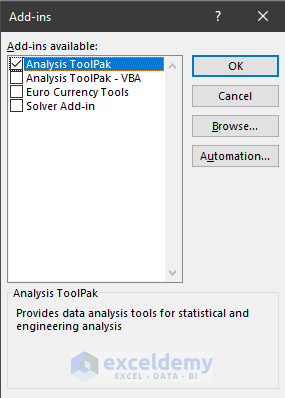
Step 5: In the Add-Ins window, select Analysis Toolpak and click OK.
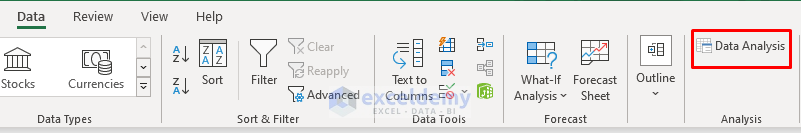
Data Analysis will be installed and will show up in the ribbon.
Read More: How to Use Analyze Data in Excel
Verifying If Data Analysis Is Installed Correctly
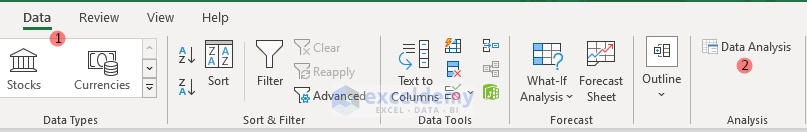
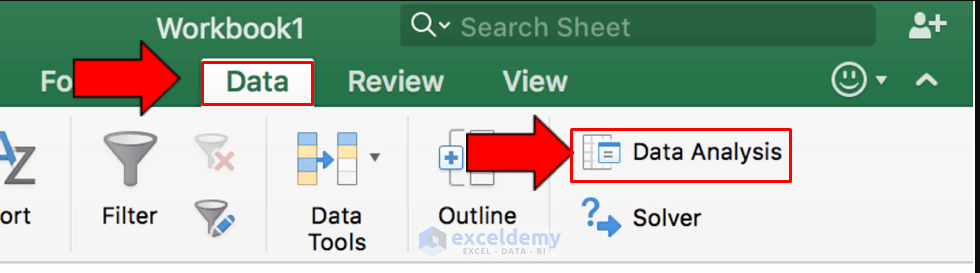
Step 1: Go to the Data tab in the ribbon and select Data Analysis.
Step 2: It will open a Data Analysis window where different Analysis Tools are present.
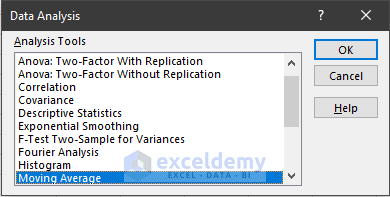
It means Data Analysis has been installed correctly.
Read More: How to Enter Data for Analysis in Excel
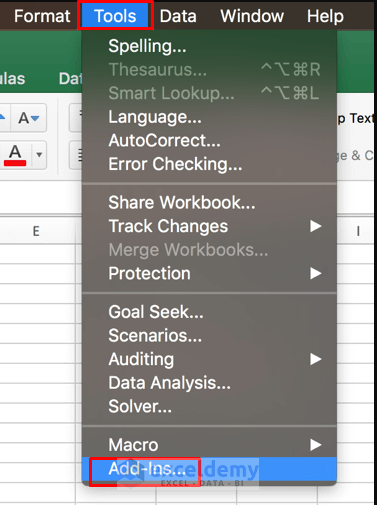
How to Install Data Analysis in macOS
The steps to install Data Analysis Toolpak in macOS are slightly different from those in Windows.
Step 1: Go to the Tools menu and click Add-Ins.
Step 2: Add-Ins available box will appear. Select Analysis Toolpak from the list and click OK.
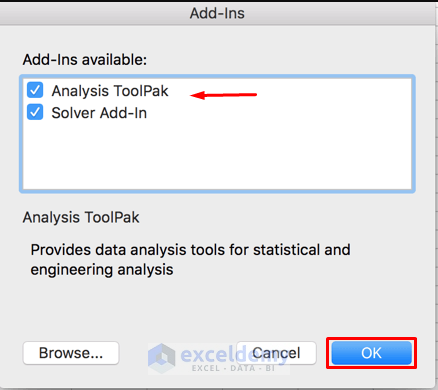
Note:
- If Analysis Toolpak is not under Add-Ins available, click browse to locate it.
- If you get a prompt that the Analysis Toolpak is not present on your device, click on the option Yes to install the Analysis Toolpak.
Step 3: Exit and restart (reopen) Excel and you will see the Data Analysis command in the Data tab.
Read More: How to Perform Case Study Using Excel Data Analysis
Related Articles
- How to Analyze Data in Excel Using Pivot Tables
- How to Make Histogram Using Analysis ToolPak
- [Fixed!] Data Analysis Not Showing in Excel
<< Go Back to Data Analysis with Excel | Learn Excel
Get FREE Advanced Excel Exercises with Solutions!

Thanks
Hello Manpreet Kaur kaur,
You are most welcome. Thanks for your appreciation. Keep learning Excel with ExcelDemy!
Regards
ExcelDemy
Thanks
Hello Bikash Neupane,
You are most welcome. Keep learning Excel with ExcelDemy!
Regards
ExcelDemy