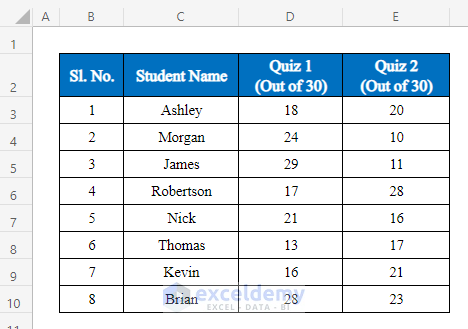
Suppose we have a dataset of Student Names and their Quiz results.
Method 1 – Using Pivot Tables to Analyze Data
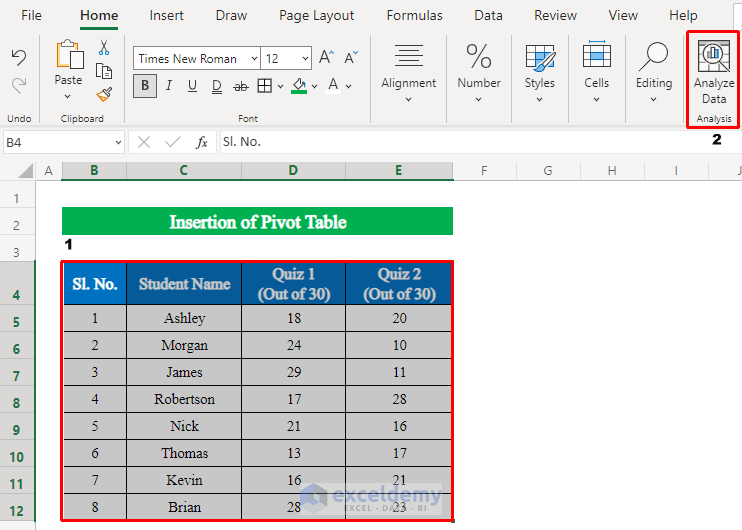
Steps:
- Select your whole dataset from the worksheet and click the “Analyze Data” option from the Home tab.
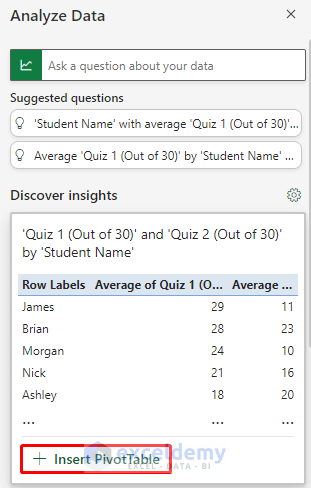
- There will be a task pane on the right of your worksheet.
- Under “Discover Insights” click “Insert Pivot Table”.
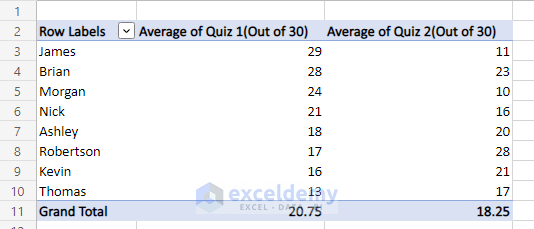
- A new sheet will be created with the pivot table.
Read More: How to Analyze Data in Excel Using Pivot Tables
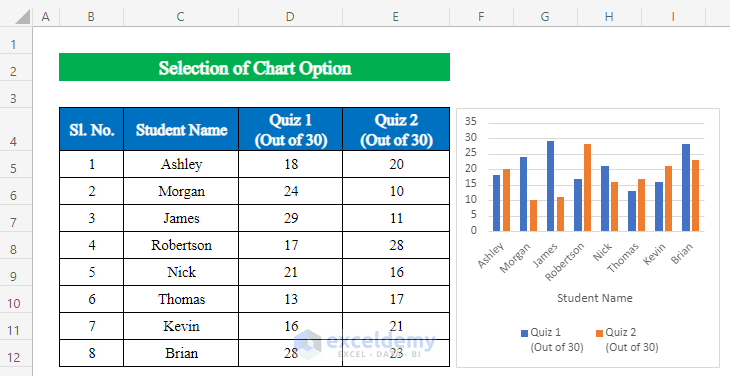
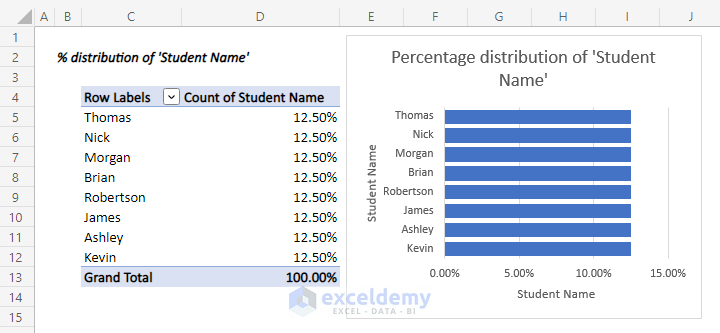
Method 2 – Using Charts to Analyze Data
You can also get chart options of different types from this feature.
Steps:
- Open the “Analyze Data” task pane.
- Choose “Insert Chart”.
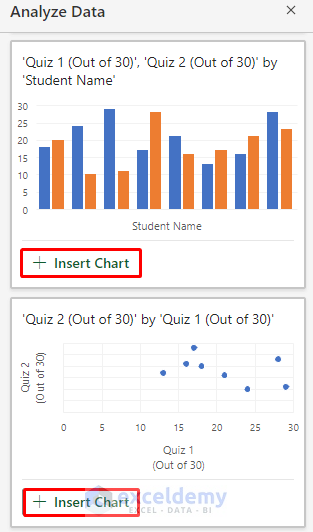
- A new chart will be created.
Read More: How to Install Data Analysis in Excel
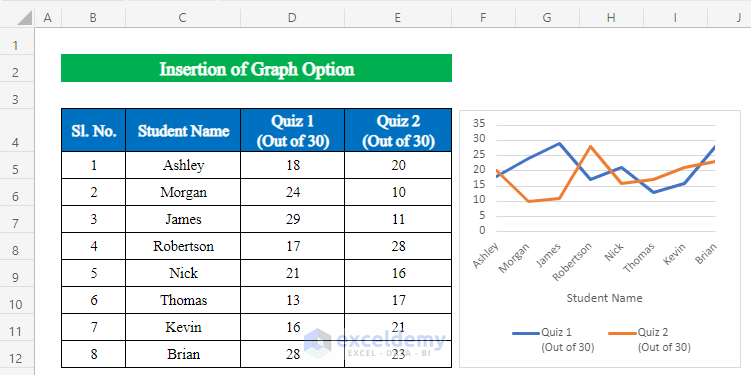
Method 3 – Using Graphs to Analyze Data
Steps:
- Open the “Analyze Data” task pane.
- Choose “Insert Chart”.
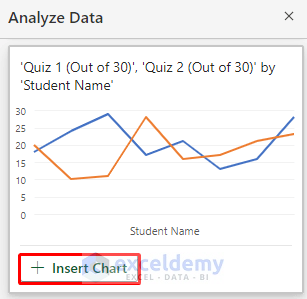
- A new graph will be created.
Method 4 – Asking Questions for Custom Results
Steps:
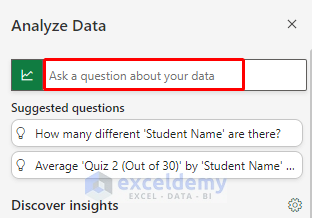
- Open the “Analyze Data” task pane.
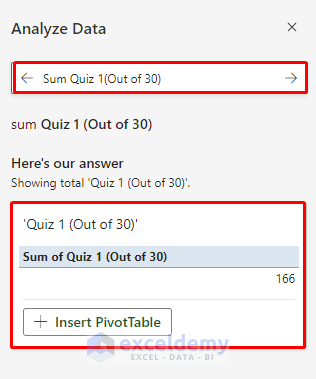
- Choose “Ask a question about your data”.
The answer will appear below the question bar.
Choose “Insert PivotChart”, if needed
Method 5 – Using the Suggested Questions List
Steps:
- Open the “Analyze Data” tab.
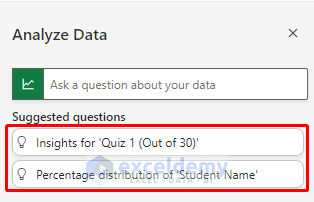
- Just below the search question bar, you will see “Suggested questions”.
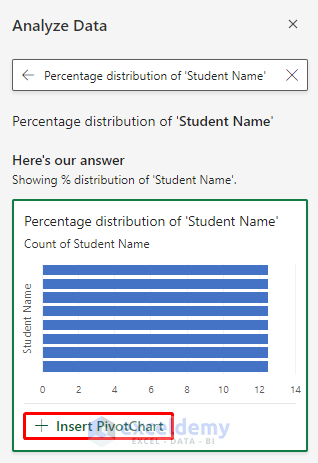
- Choose any of the suggested questions.
The answers will be below the question bar.
Choose “Insert PivotChart”, if needed.
Things to Remember
- The “Analyze Data” feature is currently only available with Microsoft 365.
Download Practice Workbook
Download this practice workbook to exercise while you are reading this article.
Related Articles
- How to Use Data Analysis Toolpak in Excel
- How to Enter Data for Analysis in Excel
- How to Perform Case Study Using Excel Data Analysis
- How to Make Histogram Using Analysis ToolPak
- [Fixed!] Data Analysis Not Showing in Excel
<< Go Back to Data Analysis with Excel | Learn Excel
Get FREE Advanced Excel Exercises with Solutions!
