Looking for ways to know how to add text to a scatter plot in Excel? Scatter Plots are really useful when representing the correlation between two numerical values. Sometimes, we need to add text to explain the chart more precisely. Here, you will find step-by-step explained ways to add text to scatter plots in Excel.
How to Add Text to Scatter Plot in Excel: 2 Ways
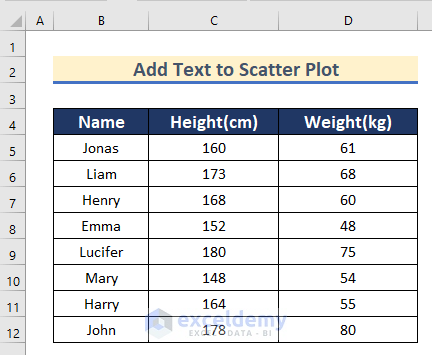
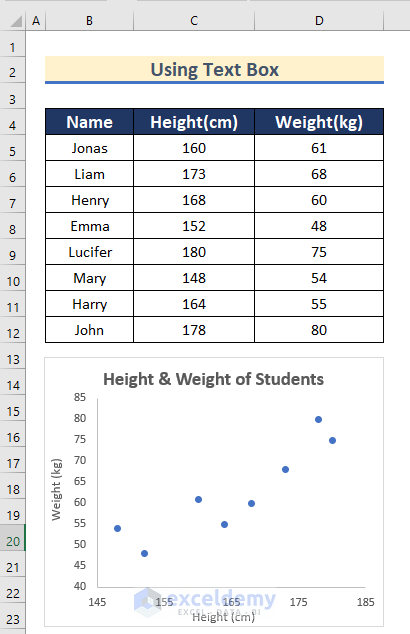
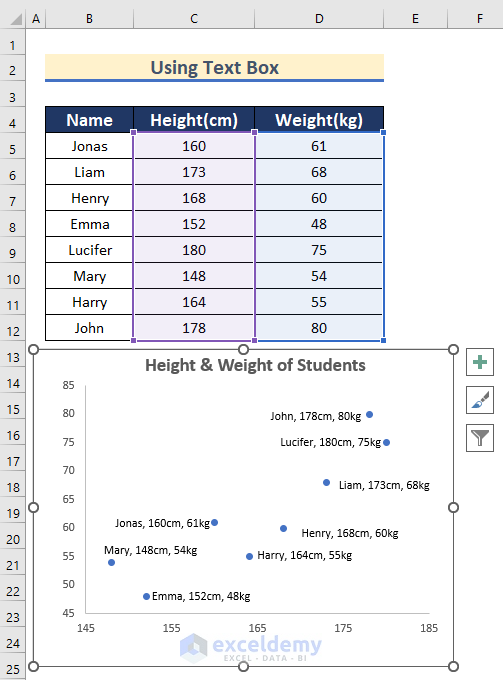
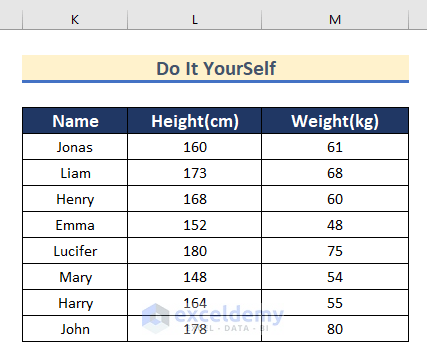
Here, we have a dataset containing the Name, Height in cm, and Weight in kg of some students. We will show you how to add text to the corresponding Scatter Plot.
1. Using Text Box Command to Add Text to Scatter Plot in Excel
In the first method, we will show you how to add text to a scatter plot in Excel using Text Box. You can add a Text Box in the scatter plot anywhere we want.
Follow the steps given below to do it on your own.
Steps:
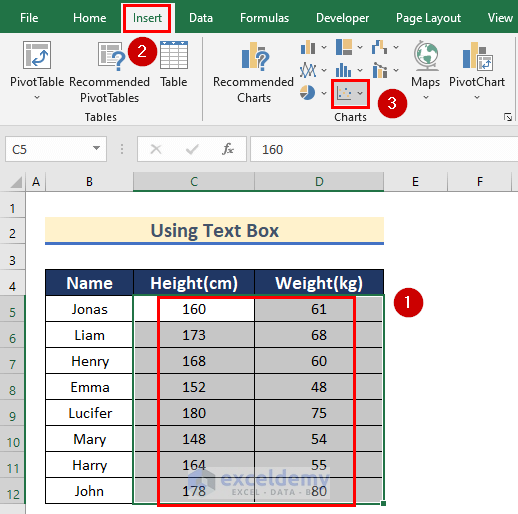
- After that, select the Scatter Plot without any lines.

- Now, a Scatter Plot will appear containing the data of Heights as X-axis and Weights as Y-axis.
- Next, double-click on the X-axis.
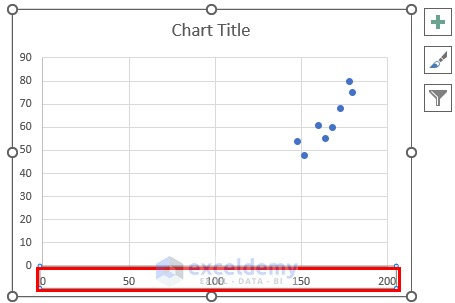
- After that, the Format Axis toolbar will open.
- Then, from Axis Options >> change the Minimum value as 145 and the Maximum value as 185.

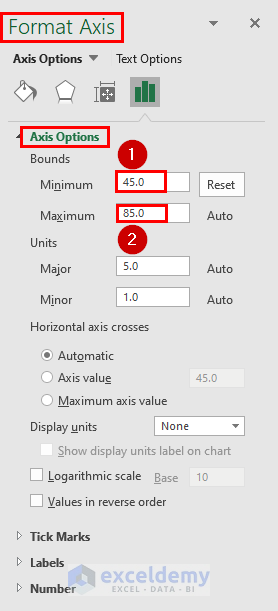
- Next, double-click on the Y-axis.
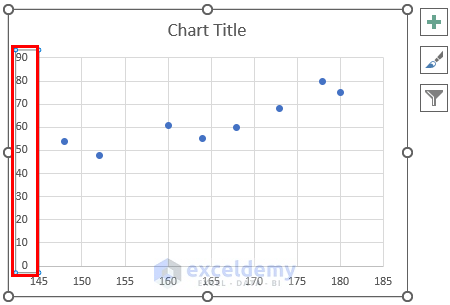
- Now, the Format Axis toolbar will appear again.
- After that, from Axis Options >> change the Minimum value as 45 and the Maximum value as 85.
- Then, click on the Chart Title to change it.
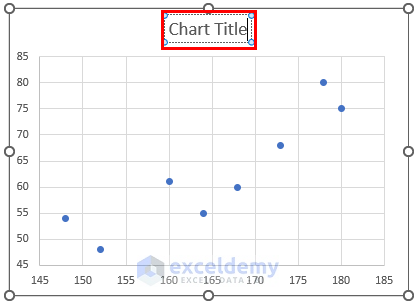
- Afterward, change the Chart Title as Height & Weight of Students.
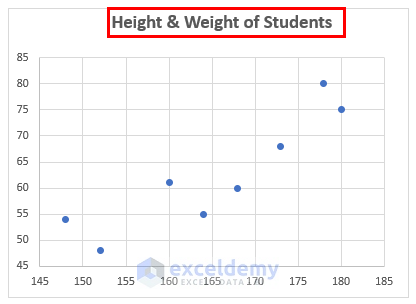
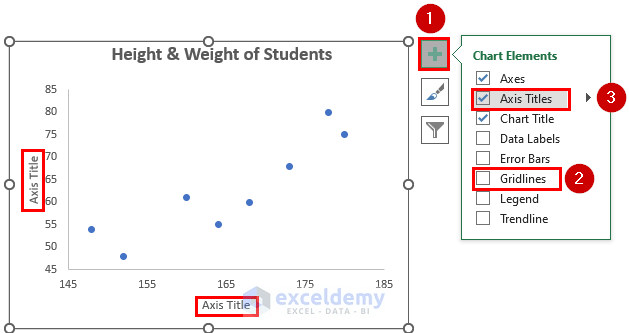
- Next, click on the “+” sign to open the Chart Elements.
- Then, turn off the Gridlines.
- After that, click on the Axis Titles to add the tiles for both of the axes.
- Now, type Height (cm) as the title of X-axis.

- Then, type Weight (kg) as the title of Y-axis.
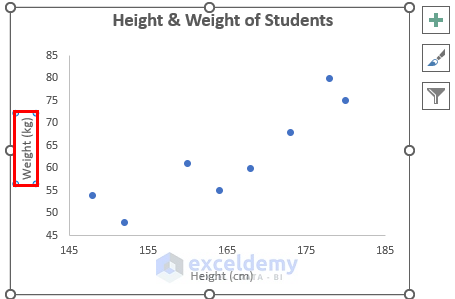
- Thus, you will get the corresponding Scatter Plot for the dataset.
- After that, select the Scatter Plot.
- Then, go to the Insert tab >> click on Text >> select Text Box.
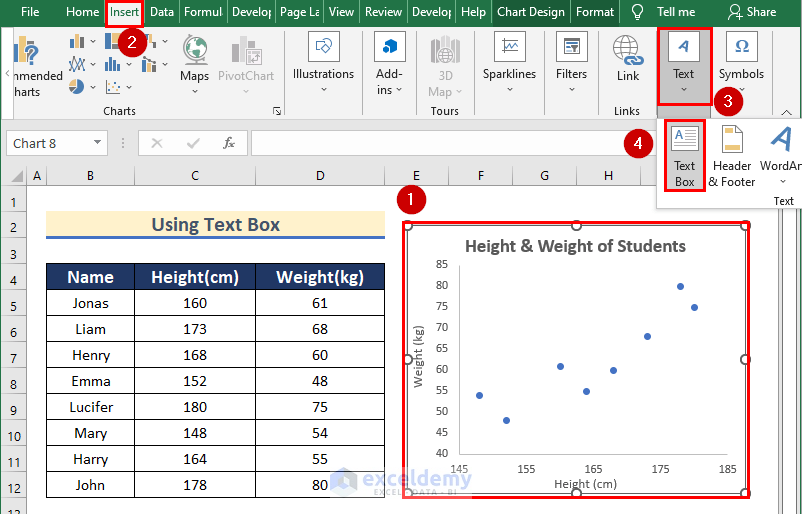
- Now, enter a Text Box into the Scatter Plot.
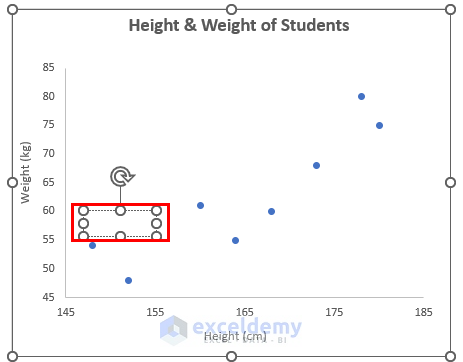
- Next, type the corresponding data of the data point in your Scatter Plot. Here, we will type Mary, 148cm, 54kg as the corresponding data of the data point.

- Then, add the other values of the data points using Text Box following the same steps.
- Finally, you will get your desired Scatter Plot with texts using Text Box.
Read More: How to Make a Scatter Plot in Excel with Two Sets of Data
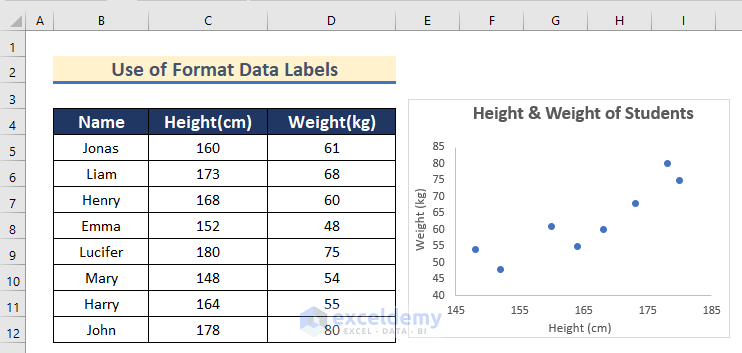
2. Use of Format Data Labels to Add Text to Scatter Plot in Excel
We can also add text to scatter plots using Format Data Labels in Excel. Please go through the steps to do it on your own dataset.
Steps:
- First, follow the steps done in Method 1 to plot Scatter Plot for your dataset.
- Then, click on the “+” sign to open the Chart Elements.
- After that, turn on Data Labels >> select More Options.

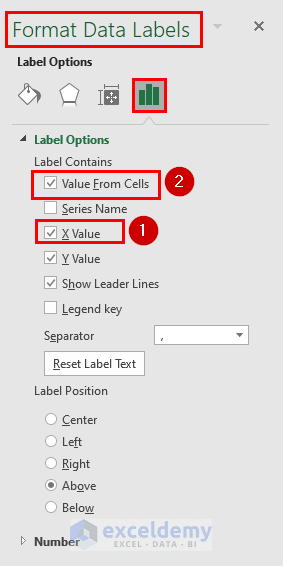
- Now, the Format Data Labels tool box will open.
- Next, turn on the X Value option.
- Then, click on Value From Cells.
- Afterward, the Data Label Range box will appear.
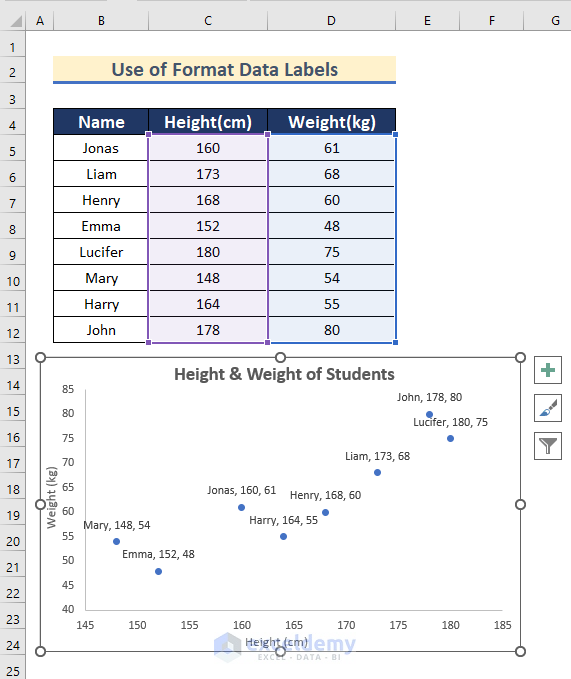
- Next, insert Cell range B5:B12 in the Select Data Label Range box.
- Then, press OK.

- Finally, you will get your desired Scatter Plot with text labels using Format Data Labels.
Things to Remember
- Make sure you have selected the scatter plot before adding text, otherwise, the text will not move if the scatter plot is moved.
Practice Section
This section gives you the dataset to practice on your own and learn to use these methods.
Download Practice Workbook
Conclusion
So, in this article, you will find a step-by-step way to add text to scatter plots in Excel. Use any of these ways to accomplish the result in this regard. Hope you find this article helpful and informative. Feel free to comment if something seems difficult to understand. Let us know any other approaches which we might have missed here. And, visit ExcelDemy for many more articles like this. Thank you!
Related Articles
- How to Create a Scatter Plot in Excel with 2 Variables
- How to Create a Scatter Plot in Excel with 3 Variables
- How to Create a Scatter Plot with 4 Variables in Excel
- How to Change Bubble Size in Scatter Plot in Excel
- How to Add Second Vertical Axis in Excel Scatter Plot
<< Go Back To Edit Scatter Chart in Excel | Scatter Chart in Excel | Excel Charts | Learn Excel
Get FREE Advanced Excel Exercises with Solutions!
