Edit Scatter Chart in Excel
Nov 11, 2025
Before making a chart with the variables from the spreadsheet, you may need to arrange them. This is comparable to the process of making a scatter ...
Nov 11, 2025
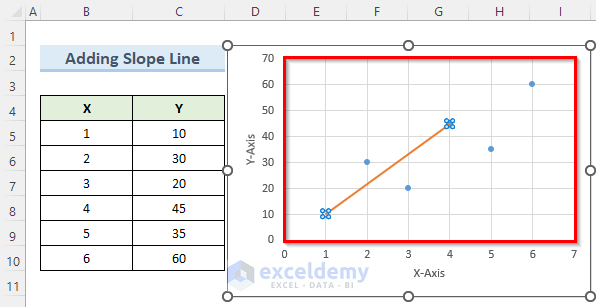
If you are looking for how to add a regression line to scatter plot in Excel, then you are in the right place. In statistics, a regression line is a ...
Jul 6, 2024
We will use this sample dataset to plot a Scatter Chart.
Step 1 - Insert Scatter Plot
Select cells in the B4:C10
Go to ...
Aug 14, 2024
This is the sample dataset.
Method 1 - Using Error Bars to Add a Vertical Line to a Scatter Plot in Excel
Steps
Select B5:C11.
...
Jul 30, 2024
Method 1 - Create an Excel Scatter Plot Color by Group without Condition
We will create three groups (A, B, and C) using the Number of Students and ...
Nov 11, 2025
Excel is a powerful tool to handle large data sets and charts. In Excel, we often use the Correlation Scatter Plot to visualize our data, find any ...
Nov 11, 2025
In this tutorial, I am going to show you how to add a second vertical axis in an Excel scatter plot. This is needed when plotting two variables on ...
Nov 11, 2025
Looking for ways to know how to add text to a scatter plot in Excel? Scatter Plots are really useful when representing the correlation between two ...
Jul 26, 2024
Dataset Overview
Suppose we have a Weight List of 10 individuals. We want to plot the Weight according to the Name of the individual in a Scatter ...
May 24, 2024
In this tutorial, I am going to share with you 3 practical examples of how to add lines to an Excel scatter plot. Lines may be needed to show a ...
Jun 20, 2024
In a Scatter Plot where the data shows little correlation, adding an average line creates a useful yardstick. Suppose we have inserted a Scatter Plot ...