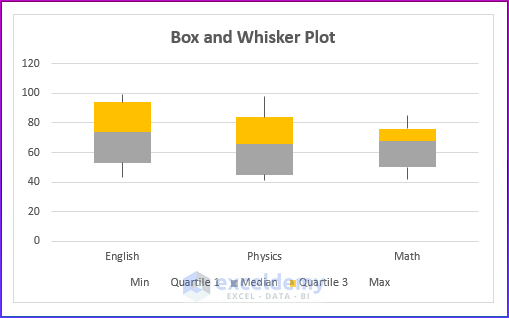
The box and whisker plot in Excel shows the distribution of quartiles, medians, and outliers in the assigned dataset. This article will ...
Waterfall Chart in Excel: Knowledge Hub How to Create a Waterfall Chart in Excel How to Make a Waterfall Chart with Multiple Series in ...
After inserting a chart, you may need to add another row or column to plot in the same Excel chart. Let's use the following dataset to demonstrate ...
Download Practice Workbook Download the following workbook. Formatting Chart in Excel.xlsx How to Insert a Chart from Data in ...
This tutorial will show you how to change the Chart Style in Excel. Learning how to change the chart style can help your charts look better overall. ...
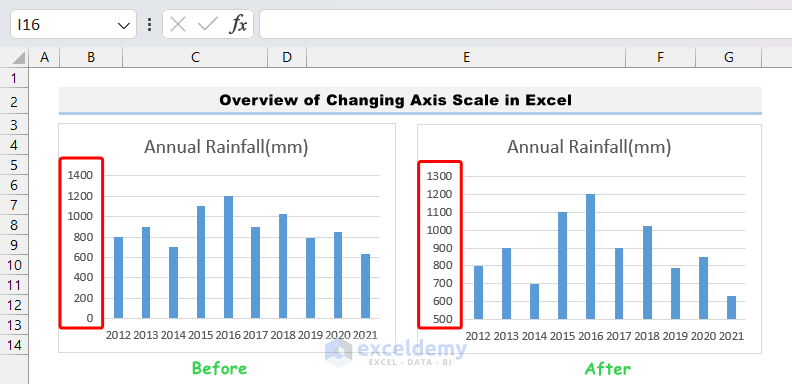
Let's use a dataset that contains information about annual rainfall for a decade and converts that into a column chart to demonstrate how to scale ...
Download Practice Workbook Customize Charts.xlsx Chart Elements in Excel There are 9 different chart elements available in Excel: ...
Download Practice Workbook Copy Chart.xlsx You can copy a chart, with or without formatting, to the same or different worksheets, ...
Excel Combo Chart: Knowledge Hub How to Create a Combination Chart in Excel How to Combine Two Graphs in Excel How to Create Column and ...
To generate the Mekko chart, we have taken the following dataset of different Markets and corresponding Company shares. Step 1 - Create ...
Excel Standard Curve: Knowledge Hub Calculate Unknown Concentration from Standard Curve in Excel How to Determine Protein Concentration from ...
Excel Control Chart: Knowledge Hub How to Make a Control Chart in Excel How to Calculate Upper Control Limit with Formula in Excel ...
Method 1 - Create 2-D Pie Chart Select any cell of the dataset >> go to the Insert tab >> select the Insert Pie or Doughnut Chart ...
Progress Chart in Excel: Knowledge Hub How to Make a Progress Chart in Excel Progress Circle Chart in Excel as Never Seen Before How to ...
Step 1 - Select the Dataset We have a sample dataset with three variables, X, Y1, and Y2. We have used 2 sample equations in order to plot ...
Advanced Excel Exercises with Solutions PDF