The following dataset will be used to determine the intersection point between two lines or graphs in Excel. Method 1 - Manually Solve a ...
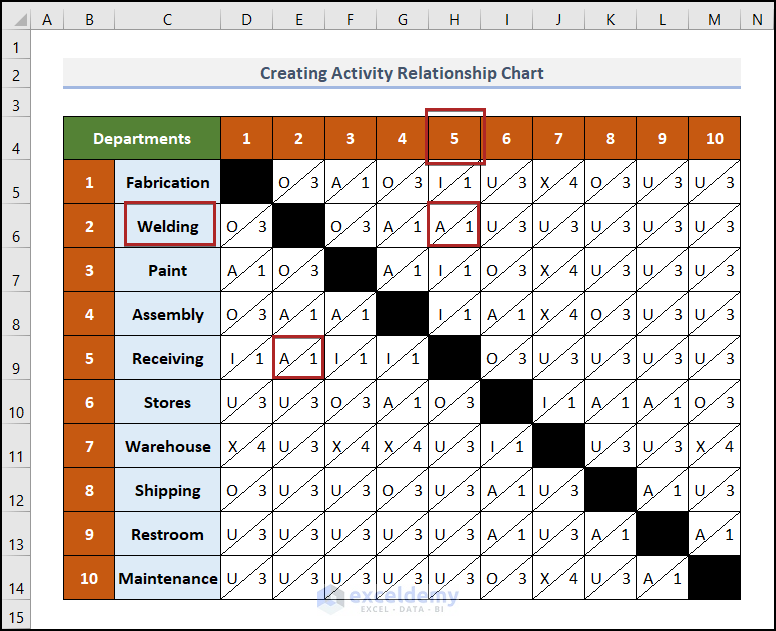
Introduction to Activity Relationship Chart The foundation for creating any form of plant layout is an Activity Relationship Chart. For this chart ...
All the combinations of products and services that a customer may buy at the current price range while staying within the limits of his or her ...
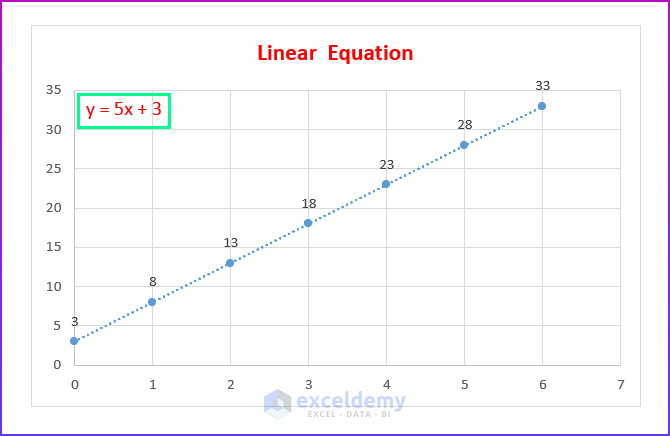
Method 1 - Plotting a Linear Equation in Excel Generally, linear equations are the most common type of equation in Excel. We use them on a regular ...
Here's an overview of a comparison chart with a Pivot Table. Read More: How to Compare Two Sets of Data in Excel Chart Method 1 - ...
Step 1 - Create a Dataset We are going to create a dataset of a company’s total sales and the total amount of each month's sales. We will put ...
Step 1 - Make a Dataset We'll include the values for Date, Measured Weight (lbs), Target Weight (lbs), Target Weight Low (lbs), and Target ...
Method 1 - Creating a Table to Refresh Chart in Excel Step 1: Select the data range. From our dataset, we will select B4 to D10 for the ...
This is a complete tutorial on How to Make or Plot a Graph or Chart in Excel. To make a complex chart like the Gantt Chart, you have to know the ...
To understand an Excel chart well, I will advise you to know the Excel chart elements very well. It is very important to be introduced to the parts ...
The dataset showcases Month number, Marketing Expense, and the Revenue in USD. Step 1 - Add a Series to the Chart ...
Advanced Excel Exercises with Solutions PDF