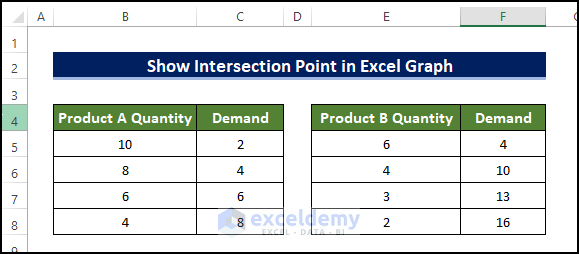
The following dataset will be used to determine the intersection point between two lines or graphs in Excel.
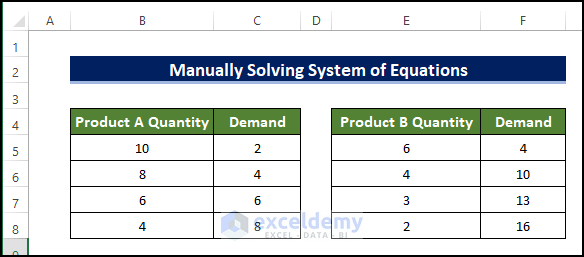
Method 1 – Manually Solve a System of Equations to Show the Intersection Point
Steps:
- We inserted information about the products and their demands as illustrated in the tables below.
- Select the range of cells B5:C8.
- Go to the Insert tab, select Insert Scatter, and choose Scatter with Smooth Line and Marker.
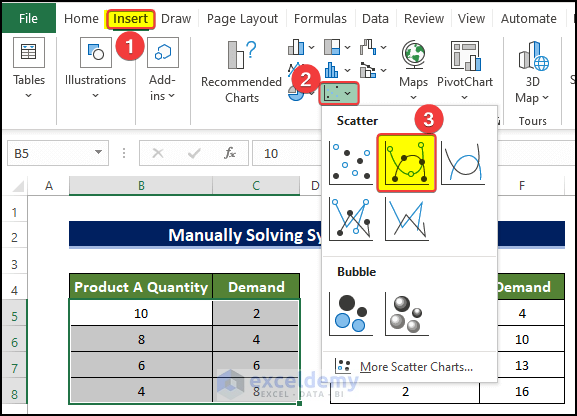
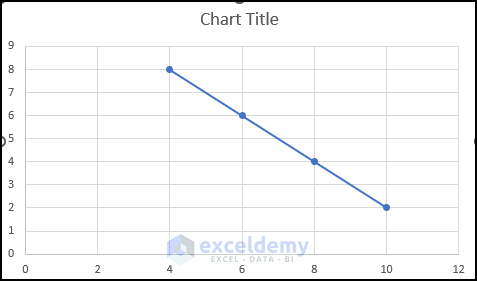
- This inserts a line or a graph.
- Right-click on the plot and click on Select Data.
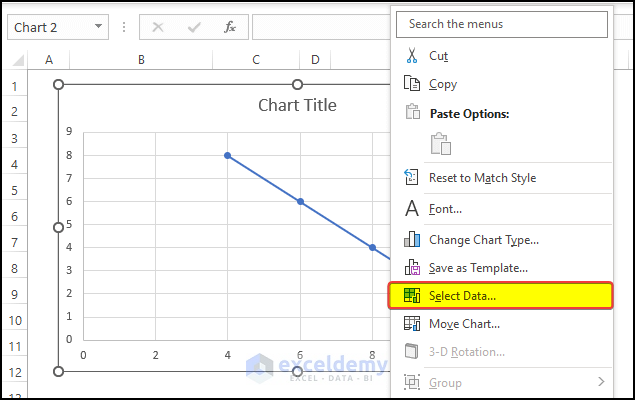
- In the Select Data Source window, click on the Add command.
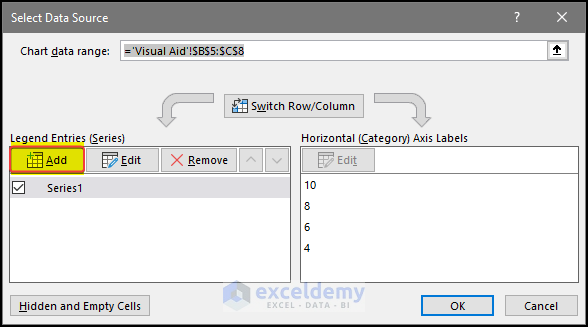
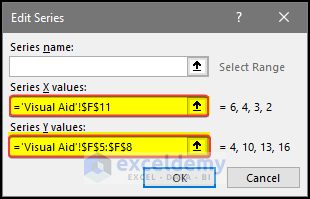
- In the Edit Series window, put the range of cells G5:G8 in the first range box and the range of cells F5:F8 in the second range box.
- Click on OK.
- Excel adds a new line.
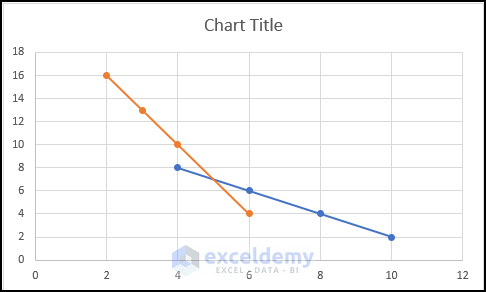
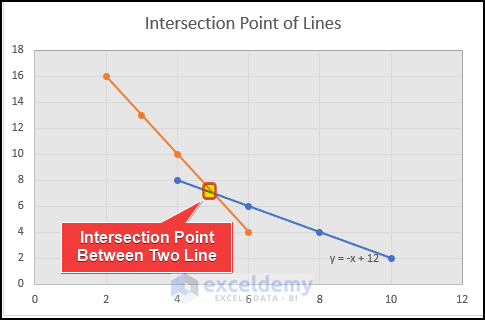
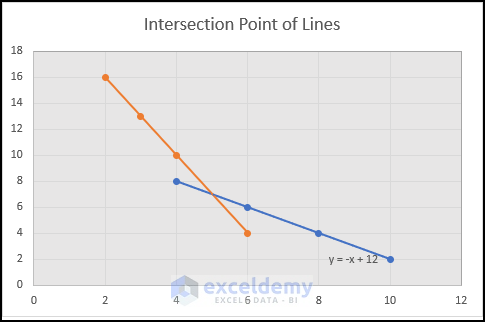
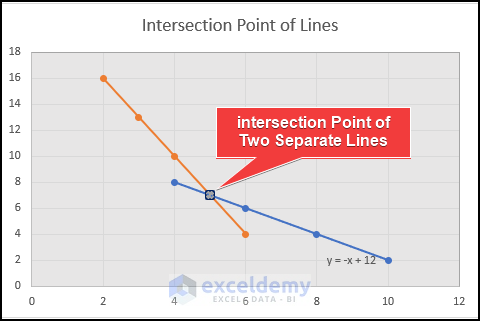
- Based on the graph, the lines intersect somewhere.
- If you graph out the lines to show more numbers, the intersection point coordinate is (5,7).
Read More: How to Find Intersection of Two Curves in Excel
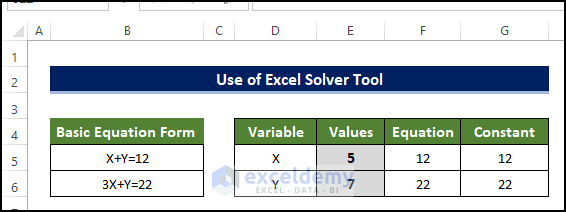
Method 2 – Display the Intersection Point in a Graph Through the Solver Tool
Steps:
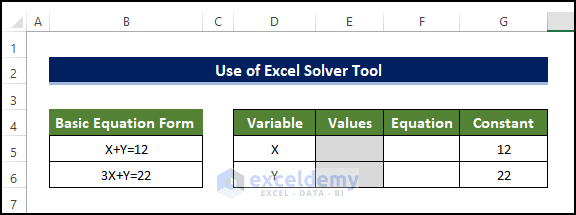
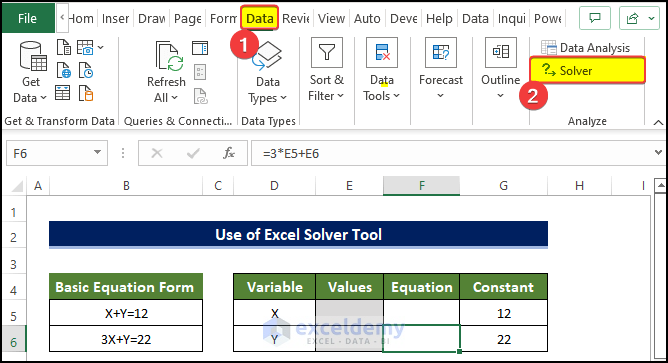
- Insert the main equations of the lines.
- Reformat the sheet as shown below.
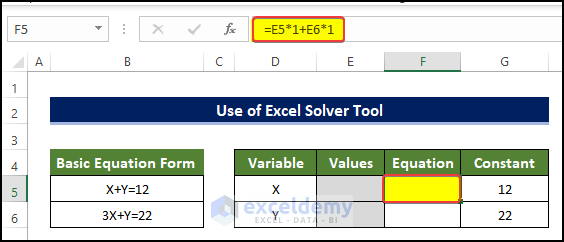
- Select cell F5 and enter the following formula:
=E5*1+E6*1
The numbers multiplied are the coefficients of each of the equations.
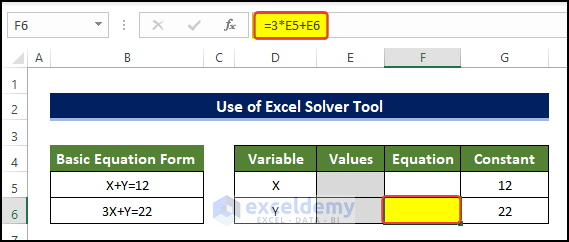
- Select the cell F6 and enter the following formula:
=3*E5+E6
Here the number multiplied is the coefficient of each of the equations.
- Select the Solver command from the Data tab.
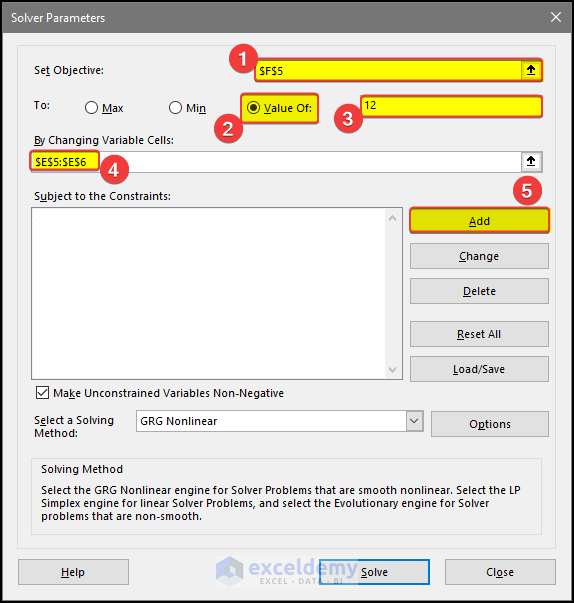
- Set the objective in the F5 cell.
- Select Value of and input 12 in the box.
- In the By Changing Variable Cells box, select the range of cells E5:E6.
- Click on Next.
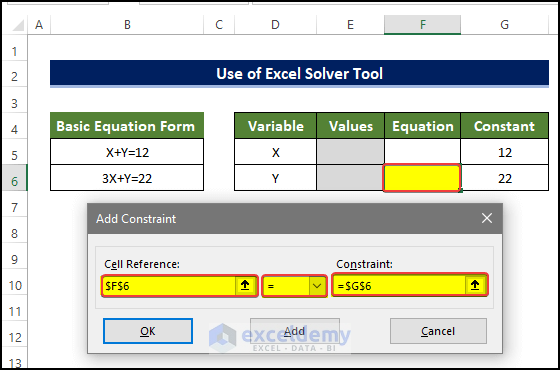
- In the Add Constraint window, put cell F6 as the cell reference and put the Equal sign in the middle.
- Put cell G6 in the constraint range box.
- Click OK.
- Go back to the previous window.
- Click Solve.
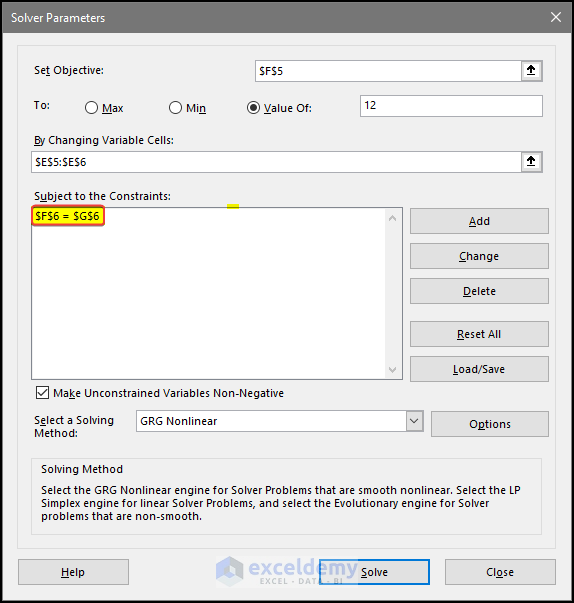
- The cells E5 and E6 now have the values 5 and 7, respectively. This is the coordinate of the intersection of the two lines in the plot.
Method 3 – Combine INTERCEPT and SLOPE Functions for an Intersection in an Excel Graph
Steps:
- We’ll go back to the previous dataset.
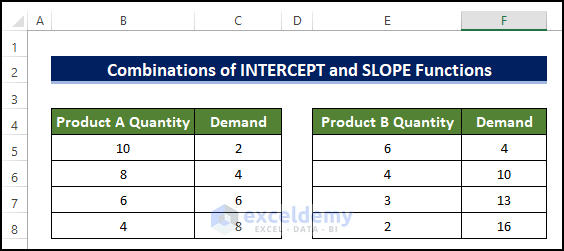
- Create a scatter plot with two lines following Method 1.
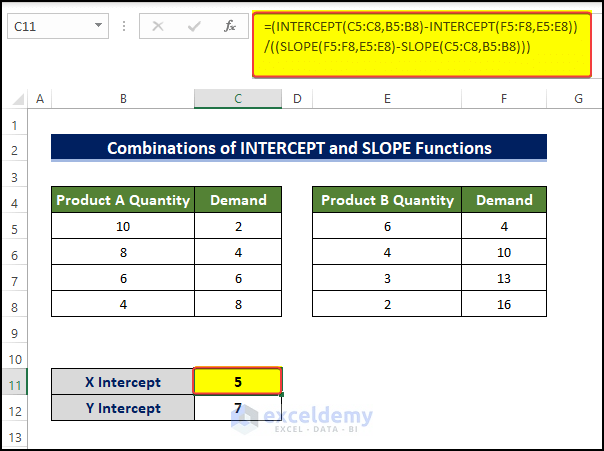
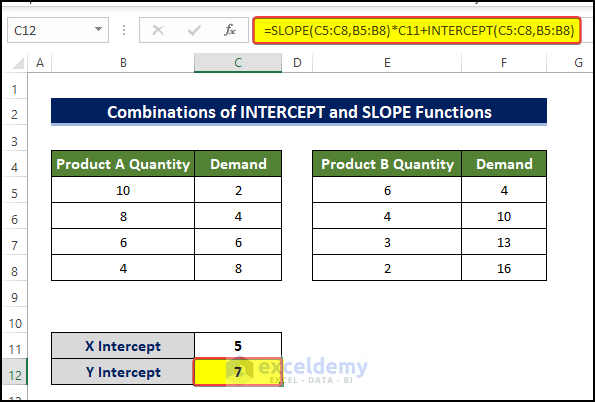
- Select cell C11 and enter the following formula:
=(INTERCEPT(C5:C8,B5:B8)-INTERCEPT(F5:F8,E5:E8))/((SLOPE(F5:F8,E5:E8)-SLOPE(C5:C8,B5:B8)))- We will get the X coordinate of the intersection.
Formula Breakdown
- INTERCEPT(C5:C8,B5:B8): This function will determine the interception of this line formed by these point in the first line in the Y axis.
- INTERCEPT(F5:F8,E5:E8): This function will determine the interception of this second line formed by these point in the first line in the Y axis.
- SLOPE(F5:F8,E5:E8): This function will determine the slope of the first line.
- SLOPE(C5:C8,B5:B8): This function will determine the slope of the second line.
- (INTERCEPT(C5:C8,B5:B8)-INTERCEPT(F5:F8,E5:E8))/((SLOPE(F5:F8,E5:E8)-SLOPE(C5:C8,B5:B8))): This function will return the abscissa of the intersection point between two lines.
- Select the cell C12 and enter the following formula:
=SLOPE(C5:C8,B5:B8)*C11+INTERCEPT(C5:C8,B5:B8)
- We will get the Y coordinate.
Formula Breakdown
- SLOPE(C5:C8,B5:B8): This function will determine the slope of the first line.
- INTERCEPT(C5:C8,B5:B8): This function will determine the interception value of the first line in the Y axis.
- SLOPE(C5:C8,B5:B8)*C11+INTERCEPT(C5:C8,B5:B8): This function will then return the ordinate of the intersection of the two lines.
- We can identify or add this point in the plot.
Download the Practice Workbook
Related Articles
- How to Create a Weight Loss Graph in Excel
- How to Make a Budget Constraint Graph on Excel
- How to Create Mekko/Marimekko Chart in Excel
- How to Create Activity Relationship Chart in Excel
<< Go Back to Excel Charts | Learn Excel
Get FREE Advanced Excel Exercises with Solutions!
