Step 1 – Select the Dataset
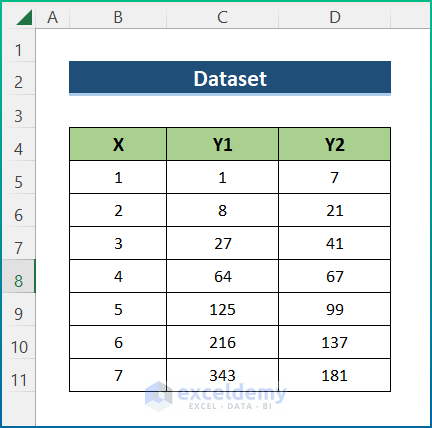
- We have a sample dataset with three variables, X, Y1, and Y2.
- We have used 2 sample equations in order to plot equations in Excel.
y = 3x2 + 5x - 1
y = x3
- We inserted a few values of X in a dataset. We used the formulas to calculate the Y1 and Y2 values.
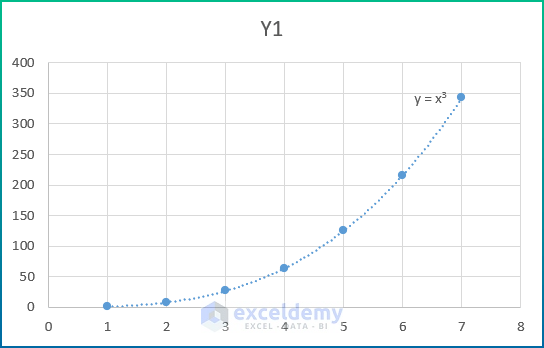
- Select columns X and Y1.
- Click the Insert tab.
- Click on the Scatter command from the Charts group of commands.
- Select the Scatter chart and modify it so it looks like this.
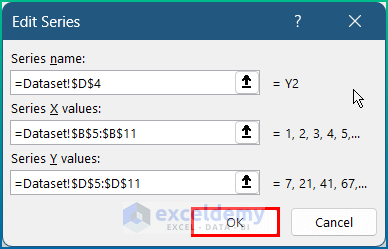
- Select the graph to Select Data and click on Add.
- Provide the X and Y values and press OK.
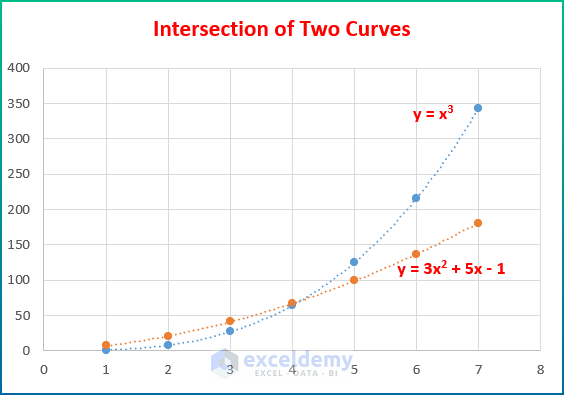
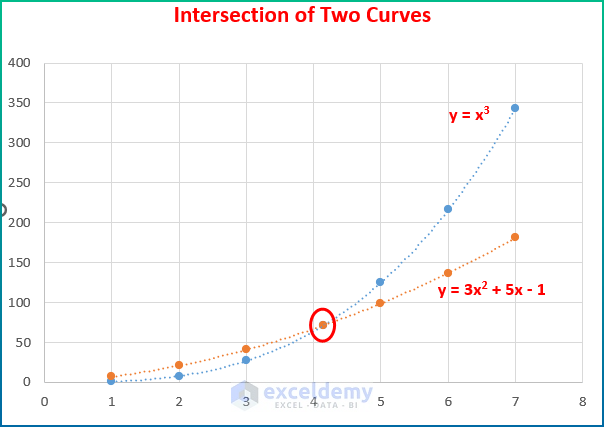
- The chart which includes the intersection of two curves will appear as below after some modifications.
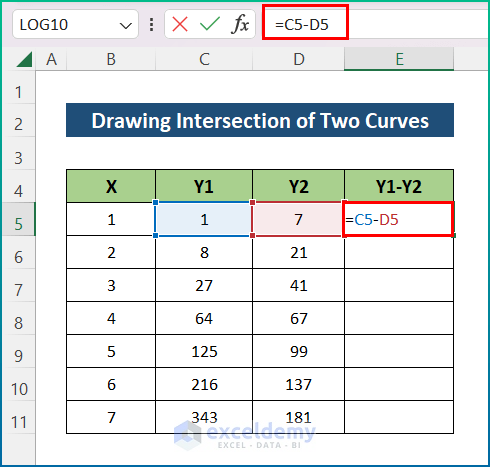
Step 2 – Calculation to Get Intersection of Two Curves
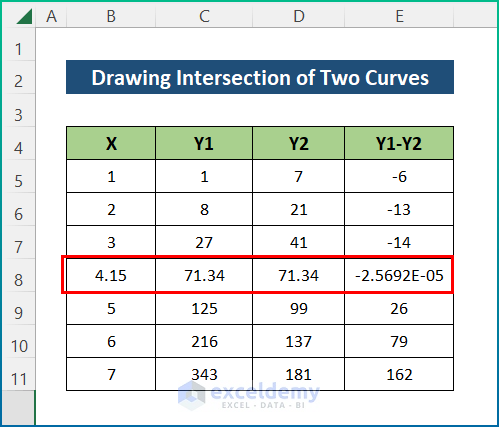
- Select cell E5 and insert the following formula to get the difference between Y1 and Y2.
=C5-D5
- Hit the Enter key and utilize the AutoFill tool to the entire column.
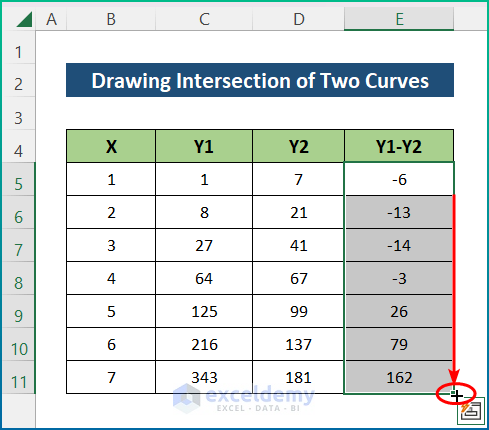
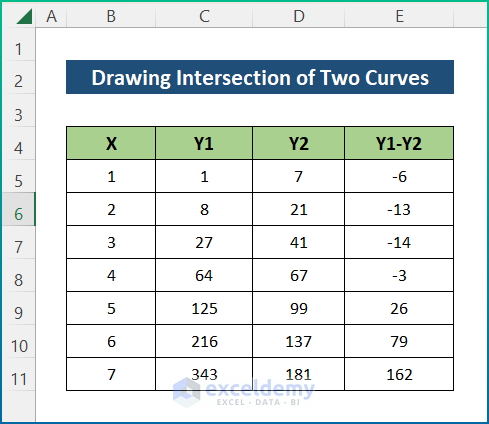
- You will get all the differences.
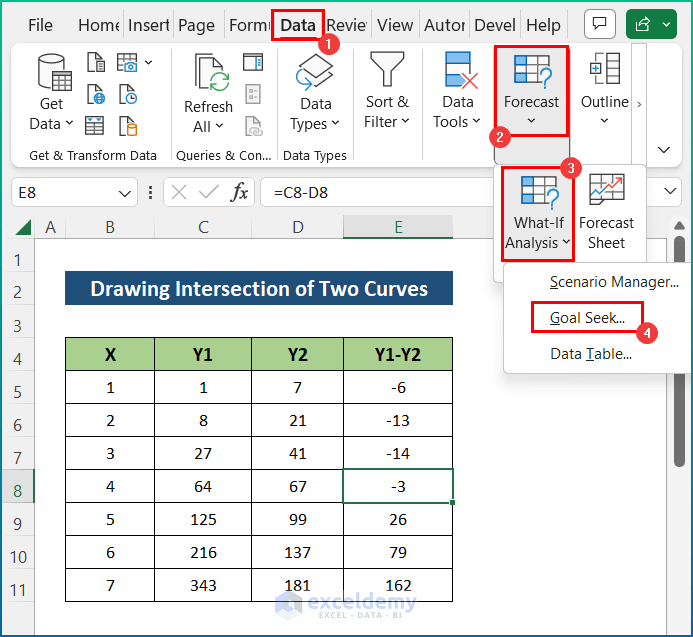
Step 3 – Find the Intersection Point in Excel
- Select any cell within range E5:E11.
- Go to the Data tab and select Forecast.
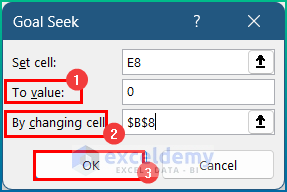
- Select Goal Seek from the What-If Analysis drop-down menu.
- Put 0 in To value.
- Select the B8 cell for By changing cell because you have to make the difference 0 by changing the value of X.
- Press OK.
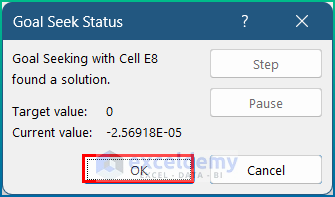
- Excel will show that it has found a solution. Press OK.
Final Output
You will get your desired point of intersection of two curves. It will appear on the same row that you have selected in the Goal Seek dialog box. We have found the value of X = 4.15 and Y = 71.34.
The difference is less than 10-5 so the solution is correct enough.
From the graph, it is evident that the point of intersection of the two curves is there.
Read More: How to Show Intersection Point in Excel Graph
Things to Remember
- First of all, there is no direct chart option to get the intersecting point of two curves.
- You can modify the chart according to your personal preference.
- You can choose any cell from the difference (Y1-Y2) range and it will provide the same solution every time.
- You can copy a row from the dataset and paste it to a different region in the sheet if you don’t want to overlap the solution with the dataset.
Download the Practice Workbook
Related Articles
- How to Create a Weight Loss Graph in Excel
- How to Make a Budget Constraint Graph on Excel
- How to Create Mekko/Marimekko Chart in Excel
- How to Create Activity Relationship Chart in Excel
<< Go Back to Excel Charts | Learn Excel
Get FREE Advanced Excel Exercises with Solutions!
