Definition of the Growth Rate
Growth Rate (AGR): The Growth rate measures profits or losses, cash flow expenses, among other factors and shows whether a company is growing,.
Growth Rate = (Ending value - Beginning value) / Beginning value
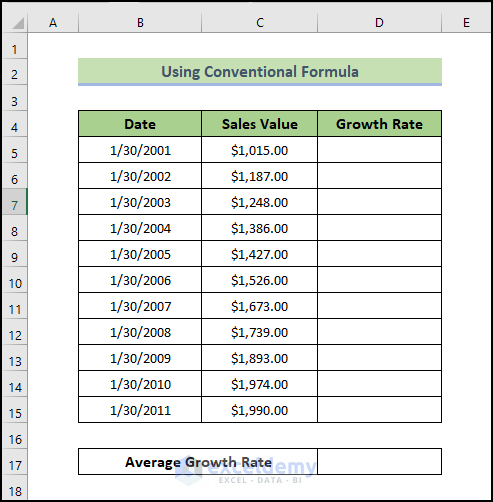
Method 1 – Using a Conventional Formula to Find the Average Growth Rate in Excel
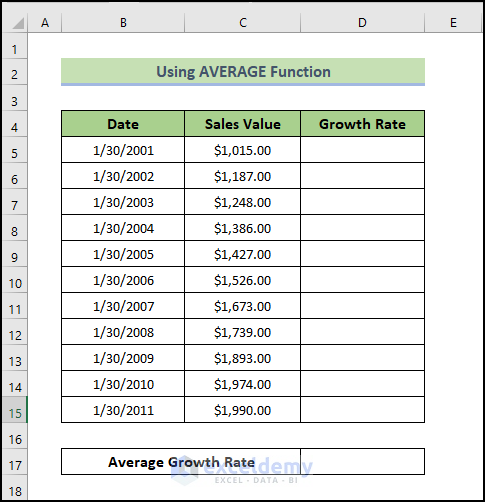
This is the sample dataset.
Steps:
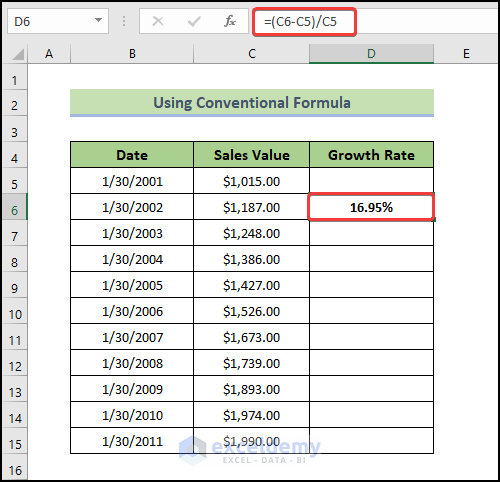
- Select a cell to display the result. Here, D6.
- Enter the following formula:
=(C6-C5)/C5
- Press Enter.
You will see the growth rate in D6.
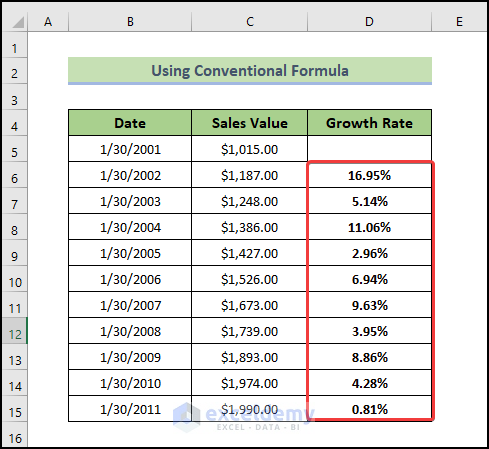
- Drag the Fill Handle to see the result in the rest of the cells.
This is the output.
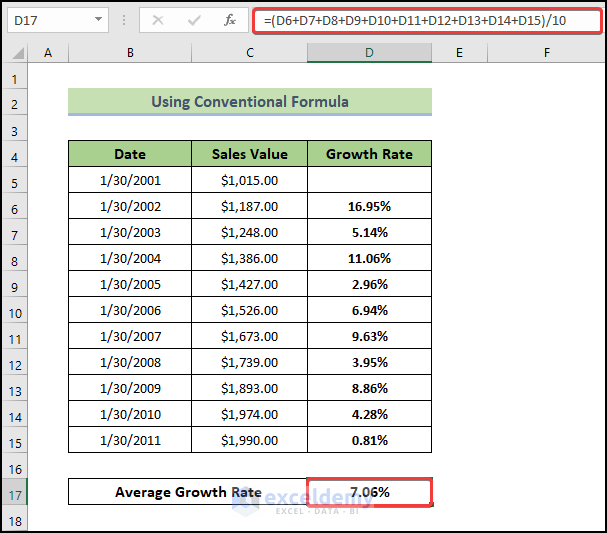
- Select D17 and enter the following formula:
=(D6+D7+D8+D9+D10+D11+D12+D13+D14+D15)/10
- Press Enter.
You will see the average growth rate in D17.
Read More: How to Calculate VLOOKUP AVERAGE in Excel
Method 2 – Find the Average Growth Rate in Excel using the AVERAGE Function
Steps:
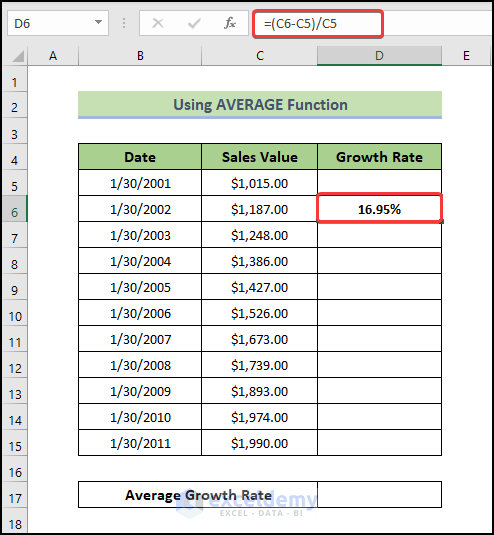
- Select a cell to display the result. Here, D6.
- Enter the following formula:
=(C6-C5)/C5
- Press Enter.
You will see the growth rate in D6.
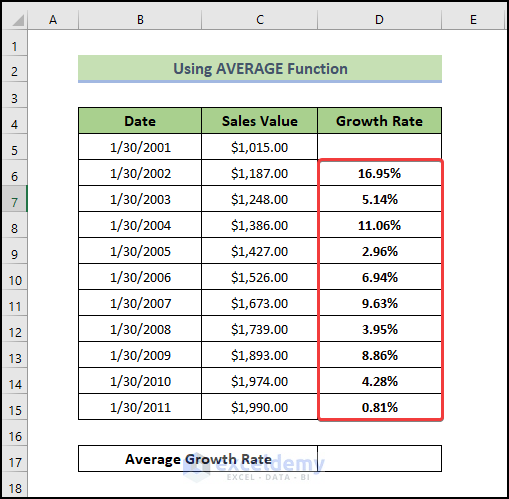
- Drag the Fill Handle to see the result in the rest of the cells.
This is the output.
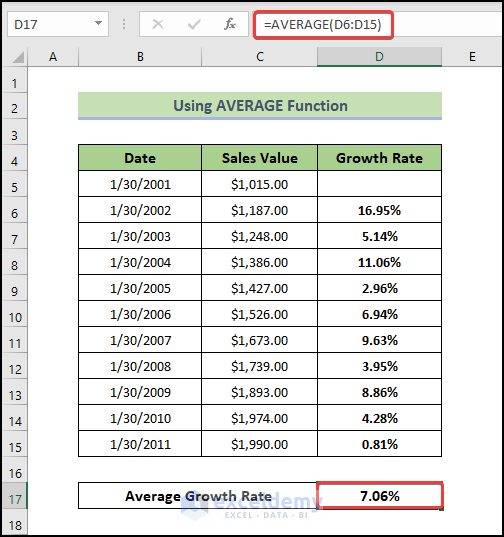
- Select D17 and enter the following formula:
=AVERAGE(D6:D15)
- Press Enter.
You will see the average growth rate in D17.
Read More: How to Calculate Class Average in Excel
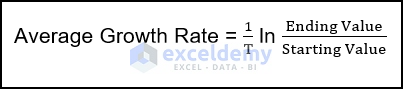
Method 3 – Using the Excel LN Function to Calculate the Average Growth Rate
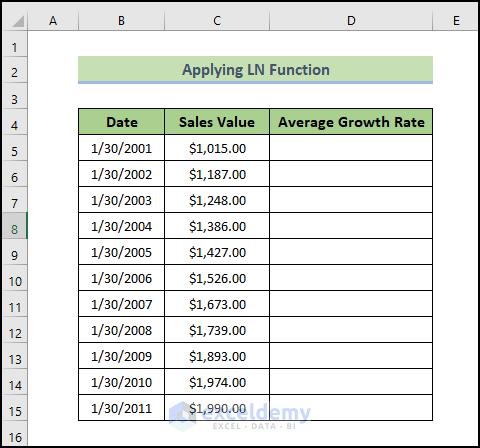
Steps:
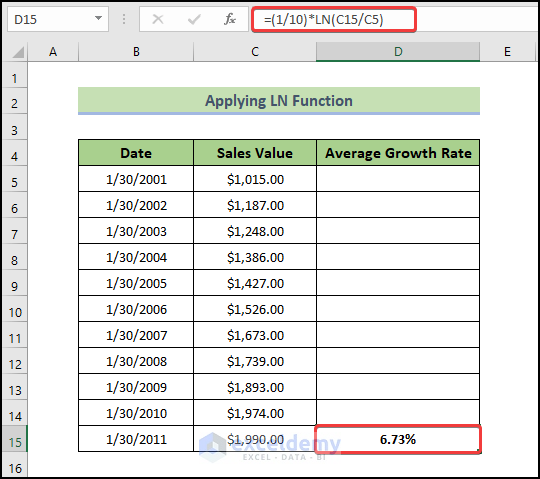
- Select a cell to display the result. Here, D15.
- Enter the following formula:
=(1/10)*LN(C15/C5)
- Press Enter.
You will see the growth rate in D15.
Read More: How to Calculate Average and Standard Deviation in Excel
How to Calculate the Average Annual Growth Rate in Excel
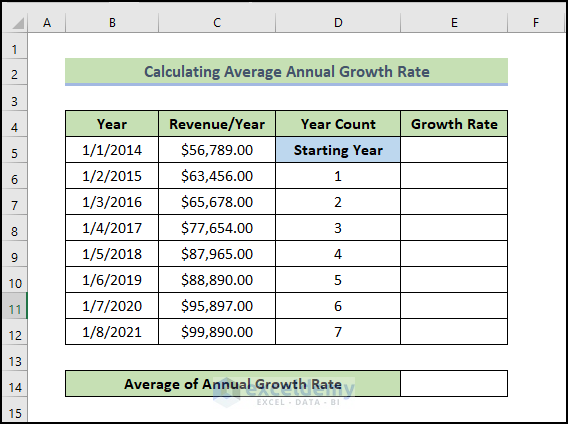
Steps:
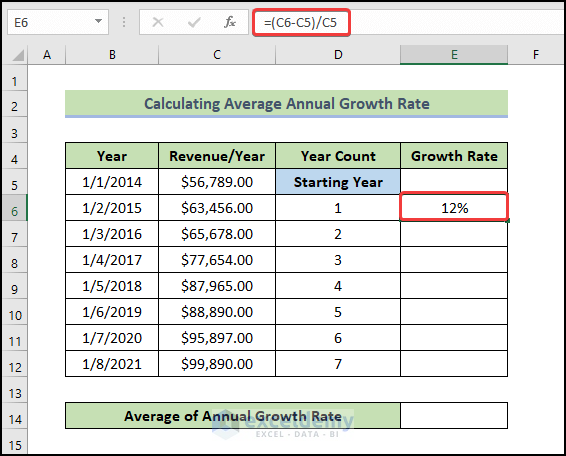
- Select a cell to display the result. Here, D6.
- Enter the following formula:
=(C6-C5)/C5
- Press Enter.
You will see the annual growth rate in D6.
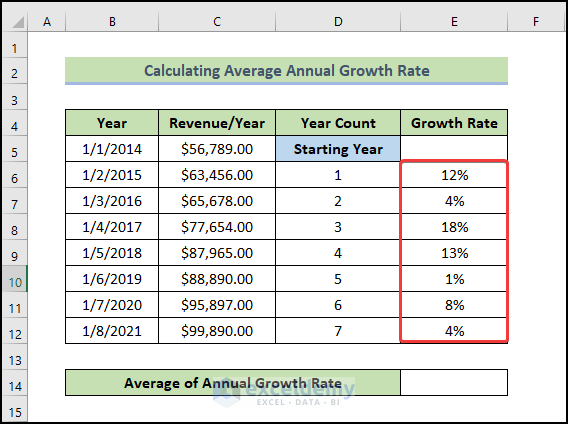
- Drag the Fill Handle to see the result in the rest of the cells.
This is the output.
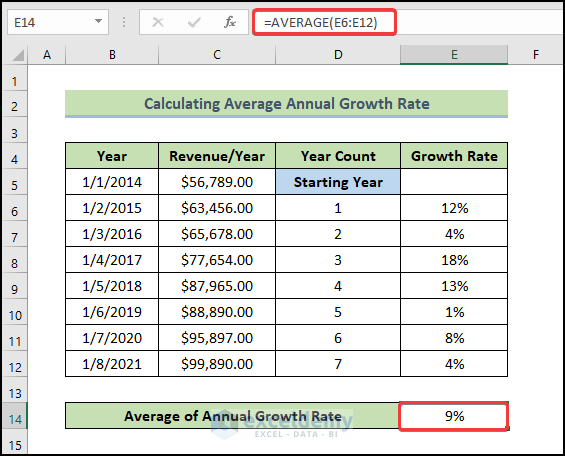
- Select D14 and enter the following formula:
=AVERAGE(E6:E12)
- Press Enter.
You will see the annual average growth rate in D14.
Read More: How to Calculate Monthly Average from Daily Data in Excel
Things to Remember
- The first cash flow result is optional when calculating the Average Annual Growth Rate (AAGR).
Download Practice Workbook
Download the practice workbook.
Related Articles
- How to Calculate Average Rating in Excel
- How to Calculate 5 Star Rating Average in Excel
- How to Get Average Time in Excel
- How to Calculate Daily Average in Excel
- How to Calculate Daily Average from Hourly Data in Excel
- How to Calculate Weekly Average in Excel
<< Go Back to Excel Average Formula Examples | How to Calculate Average in Excel | How to Calculate in Excel | Learn Excel

