Basics of Average and Standard Deviation
What is The Average
The average is the arithmetic mean.
What is The Standard Deviation
Standard deviation is a quantity representing the amount of dispersion. It refers to the deviation of a value from the mean of all values. The equation for measuring standard deviation is:
Xi is the i-th value of the entire population,
μ is the mean value,
n is the number of values of the entire population.
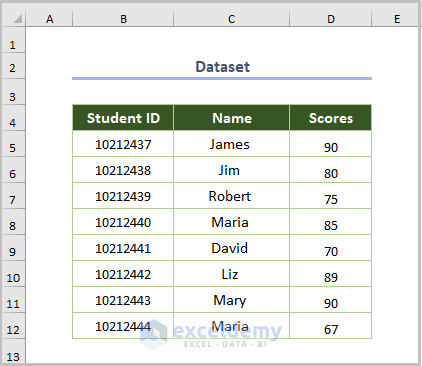
This is the sample dataset. To calculate the average and standard deviation:
1. Calculating the Average in Excel
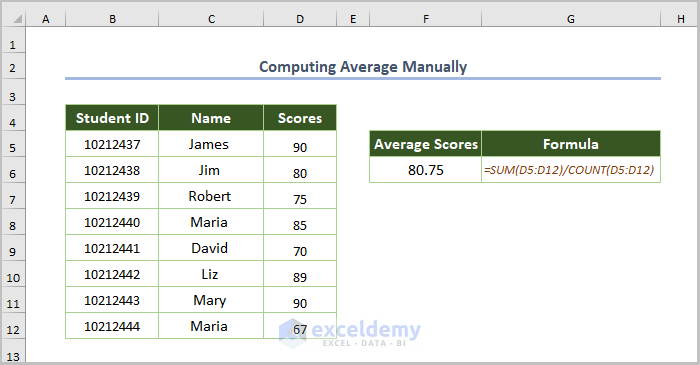
1.1. Computing the Average Manually
- Use the formula:
=SUM(D5:D12)/COUNT(D5:D12)The SUM function returns the total scores and the COUNT function counts the number of scores. Total scores are divided by the number of scores.
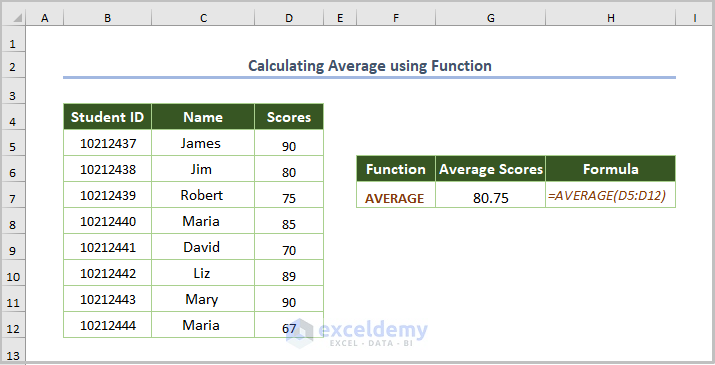
1.2. Calculating the Average Using a Function
- Use the formula:
=AVERAGE(D5:D12)
D5:D12 is the cell range.
Read More: How to Calculate Sum & Average with Excel Formula
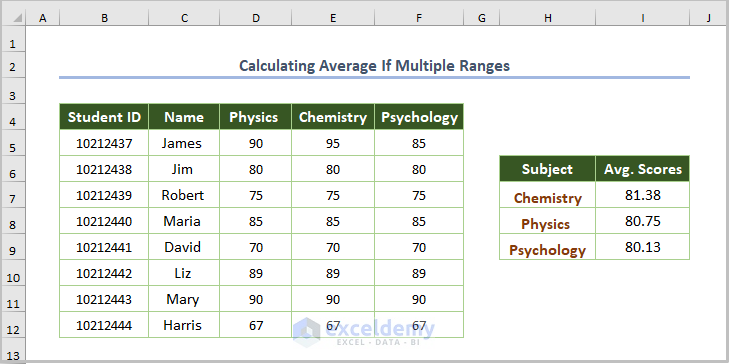
1.3. Calculating the Average for Multiple Ranges
To compute average scores for Physics, Chemistry, and Psychology:
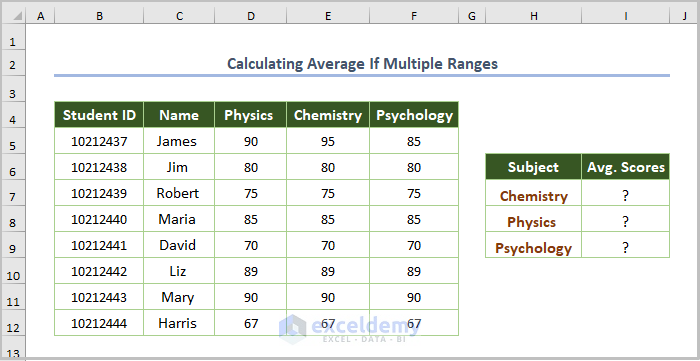
- Select the entire dataset and go to the Formulas tab.
- Choose Create from Selection in Defined Names.
- Use the Name Manager to save the dataset.
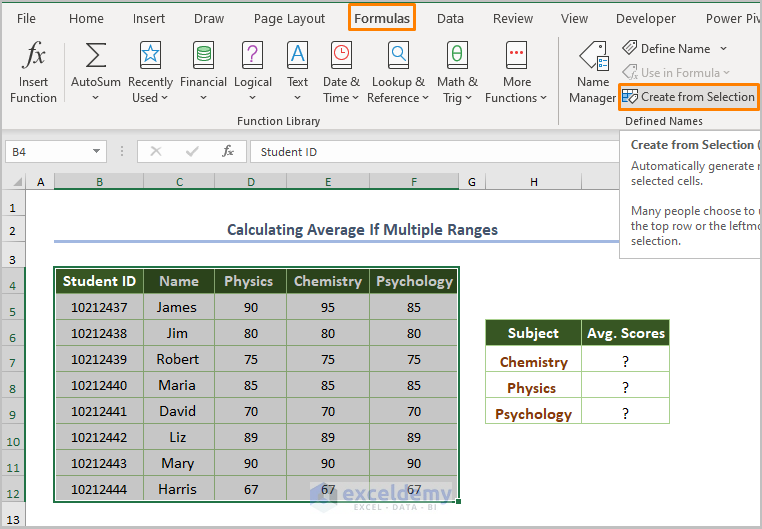
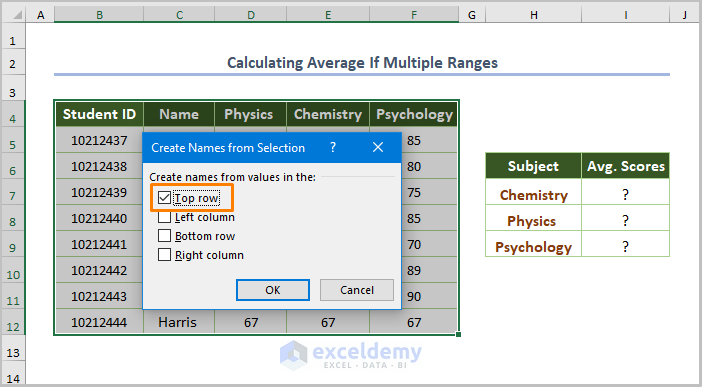
- In the dialog box, check Top row.
- Use the following formula for Chemistry: H7.
=AVERAGE(INDIRECT(H7))
The INDIRECT function finds all scores in Chemistry, the AVERAGE function calculates the average scores.
- Use the Fill Handle to copy the formula.
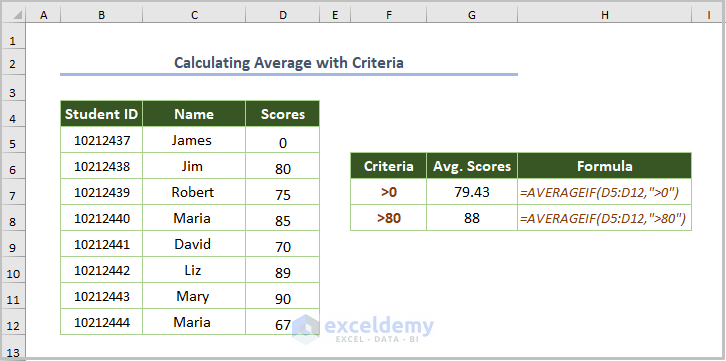
1.4. Determining the Average with Criteria
A student obtains 0 and you need to ignore the 0. To calculate the average of scores greater than 0:
- Use the formula below:
=AVERAGEIF(D5:D12,">0")D5:D12 is the range and >0 finds the average excluding 0.
- To measure the average of scores greater than 80, the formula is:
=AVERAGEIF(D5:D12,">80")>80 calculates the average including scores above 80.
2. Calculating the Standard Deviation in Excel
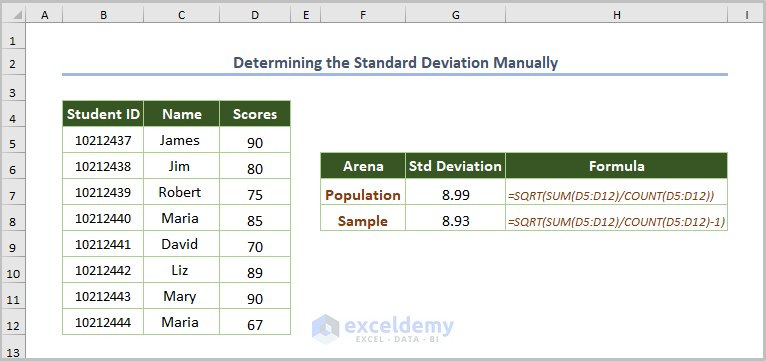
2.1. Determining the Standard Deviation Manually
- Use this formula:
=SQRT(SUM(D5:D12)/COUNT(D5:D12))The SQRT function returns the square root of the output found by dividing the total scores by the number of scores.
If we consider the sample data, the formula will be:
=SQRT(SUM(D5:D12)/COUNT(D5:D12)-1)
Subtract 1 from the number of the entire population.
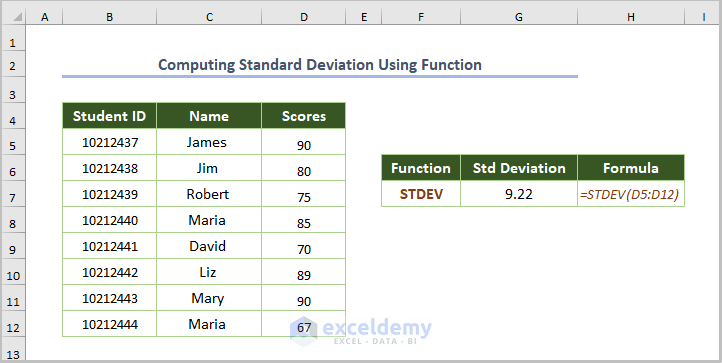
2.2. Computing the Standard Deviation by Applying a Function
=STDEV(D5:D12)
D5:D12 is the range.
Read More: How to Calculate Average Deviation in Excel Formula
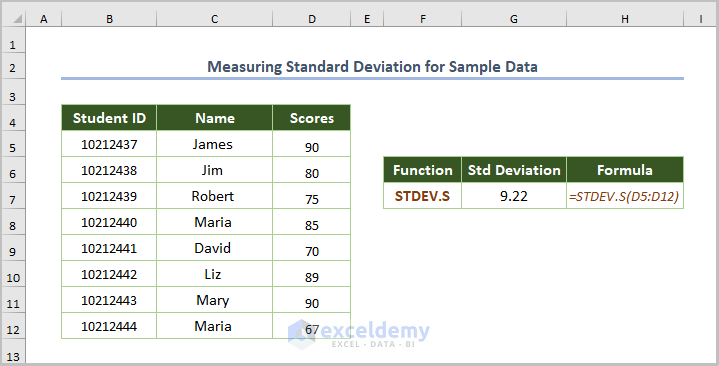
2.3. Measuring the Standard Deviation for Sample Data (STDEV.S function)
- Use the STDEV.S function:
=STDEV.S(D5:D12)
2.4. Calculating the Standard Deviation for the Entire Population (STDEV.P function)
- Use the formula:
=STDEV.P(D5:D12)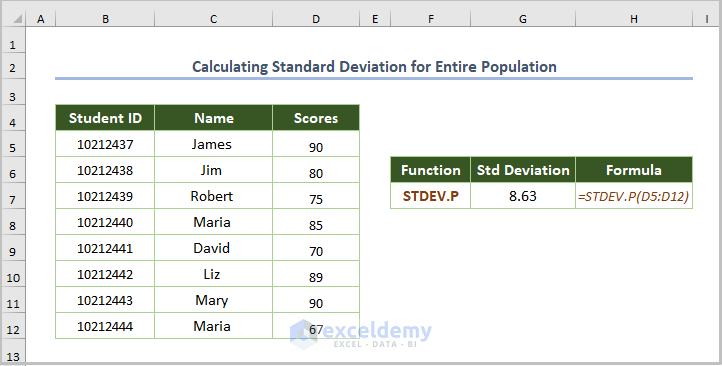
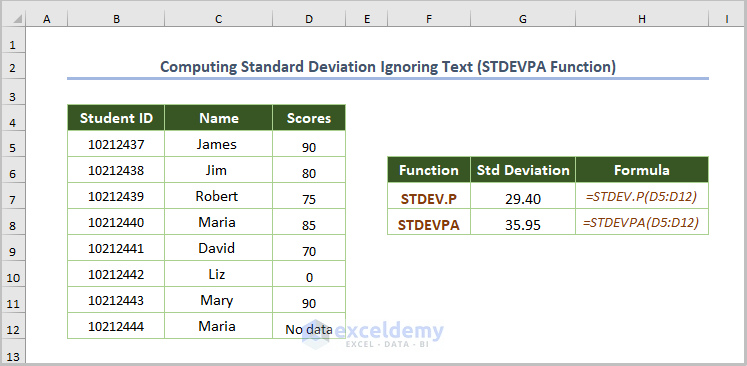
2.5. Computing the Standard Deviation Ignoring Text (STDEVPA Function)
- Use the following formula:
=STDEVPA(D5:D12)
Common Errors while Calculating Average and Standard Deviation in Excel
| Name of Errors | When Occurs |
|---|---|
| #N/A! | the dataset contains an error. |
| #VALUE! | there are text values in the dataset. |
| #DIV/0! | there is only one numeric value in the dataset. |
Download Practice Workbook
Related Articles
- How to Calculate Average Excluding Outliers in Excel
- How to Calculate Average of Text in Excel
- How to Average Negative and Positive Numbers in Excel
- How to Do Subtotal Average in Excel
- How to Average Filtered Data in Excel
<< Go Back to Calculate Average in Excel | How to Calculate in Excel | Learn Excel
Get FREE Advanced Excel Exercises with Solutions!
