Sometimes, when we group rows in Excel, the plus sign that appears as an outline can be confusing to use. We can change this by moving it on top for a better demonstration. In this article, we will see two simple methods for Excel group rows using plus sign on top. For your better understanding, we will use a sample dataset.
How to Group Rows with Plus Sign on Top in Excel: 2 Simple Ways
We will see the use of Outline setting and Pivot table to move group rows plus sign on top.
Method 1: Group Rows with Plus Sign on Top Using Data Tab
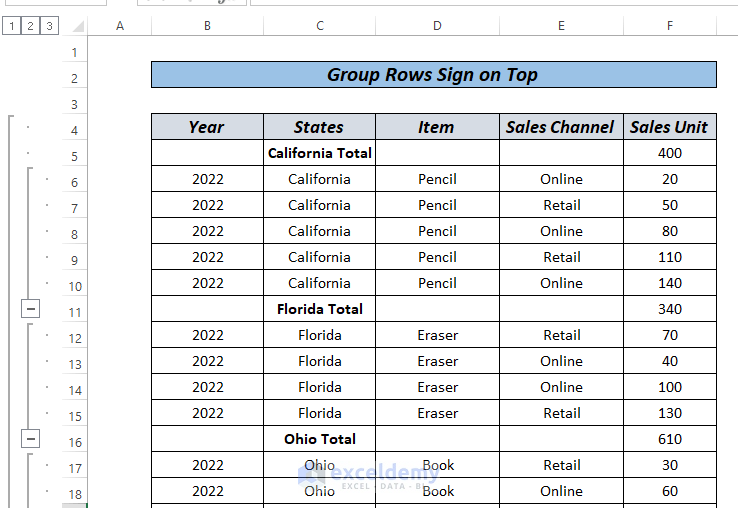
Let’s assume that, we have a dataset that is grouped but the plus sign is in such a place that, it is confusing to group and ungroup by clicking the plus sign. We can see a plus sign just beside the Florida Subtotal.
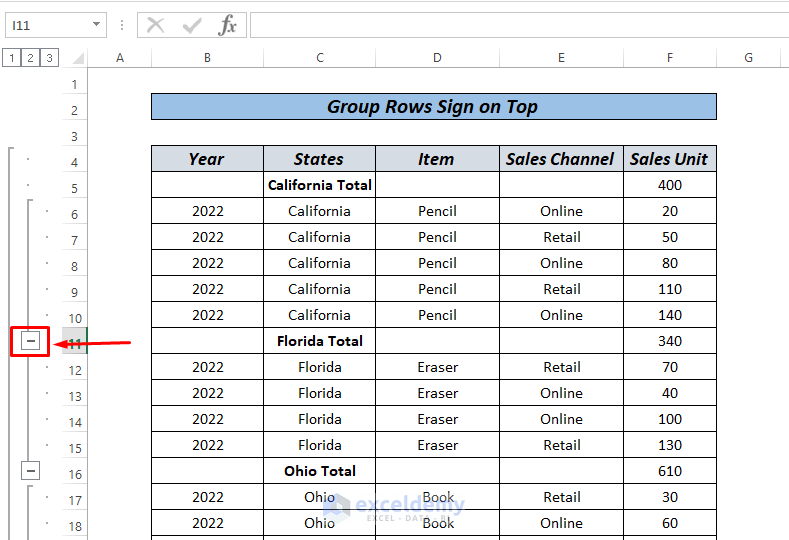
But if we click that it hides all the data for California. This means this plus sign is for California and we need to move that on top for better presentation.
Steps:
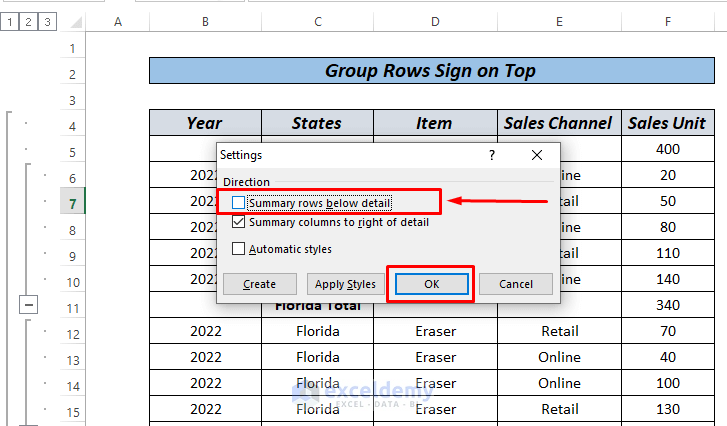
- First, go to the Data Tab and click the arrow sign in the Outline box.
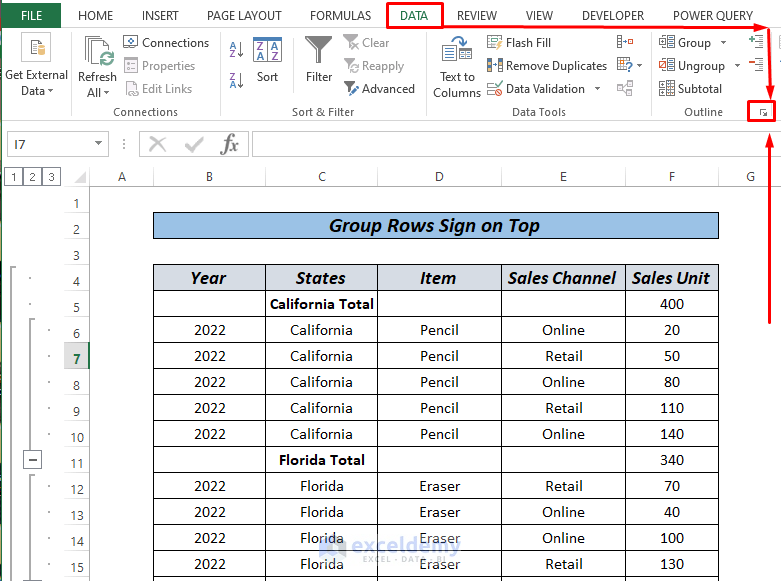
- As a result, a dialogue box will pop up, and Uncheck the Summary rows below detail and click OK.
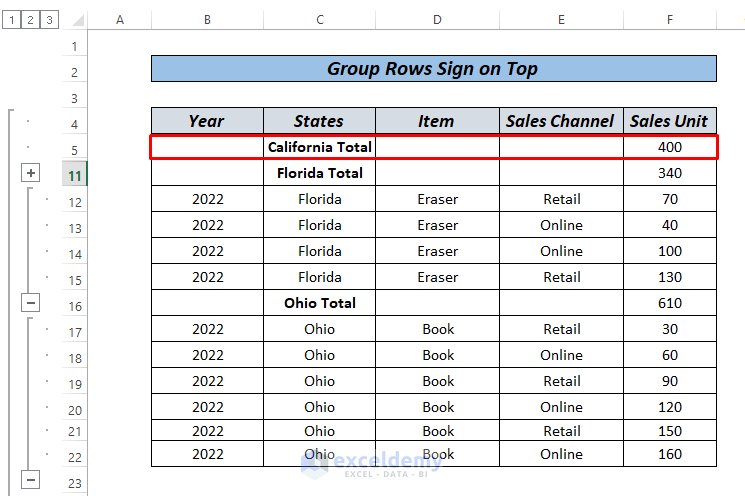
That’s it.
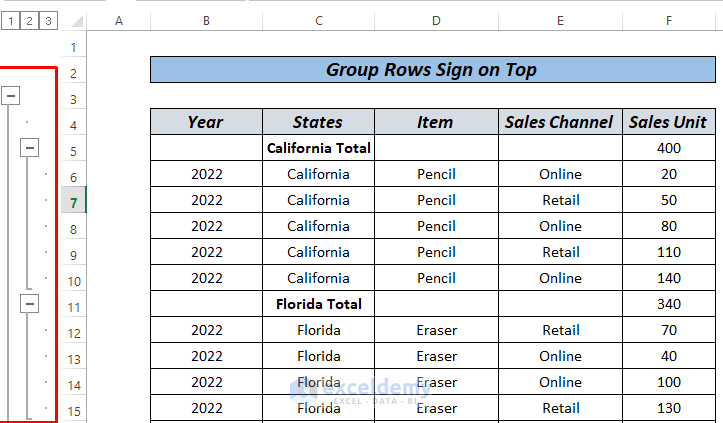
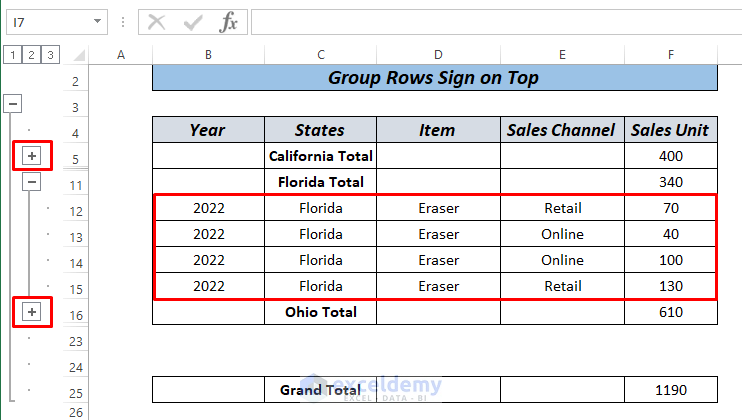
- Now, if we click the minus sign in California Total and Ohio Total we will get our desired result as follows.
Read More: How to Group Rows by Cell Value in Excel
Method 2: Group Rows with Plus Sign on Top Using Pivot Table
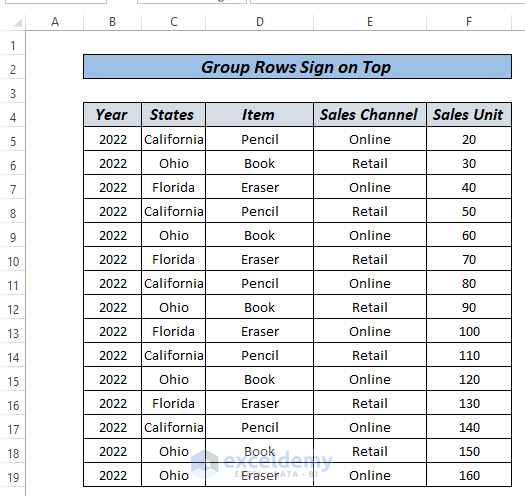
We can also use Pivot Table to group rows by cell value in Excel. Suppose, we have our dataset like the image below initially.
Let me show you, how you can do this.
Steps:
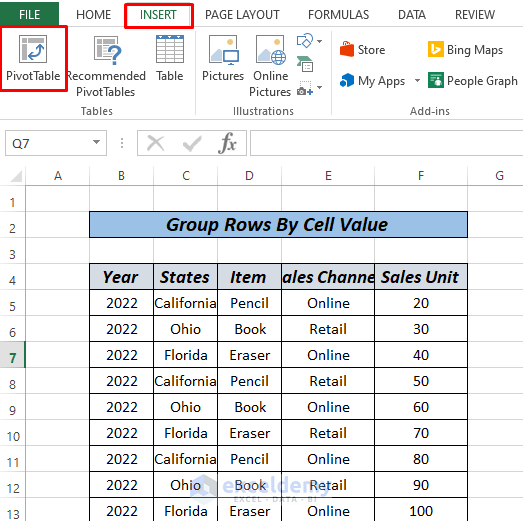
- First, we have to insert a pivot table. We will simply go to the Insert tab and click on the Pivot table like the following picture shows.
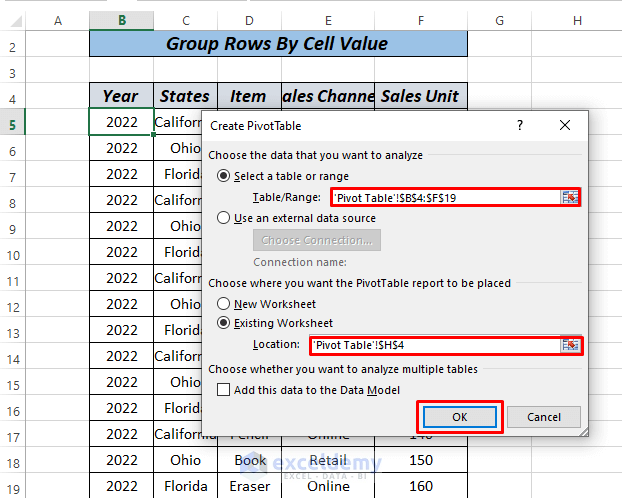
- After that, a dialogue box will pop up. From here, we will select the table range and select a cell where we want our table to be. Now, click OK.
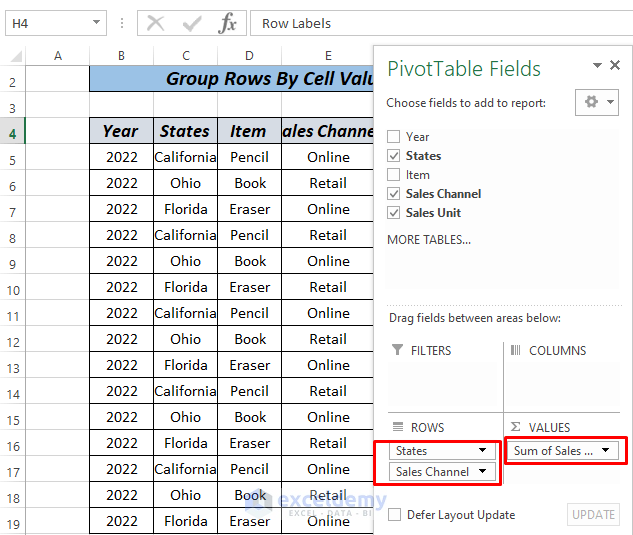
- As a result, we will get another dialogue box. Now, we will drag the States and Sales Channel to the Row and Sales Unit in the Values section, as the following image describes.
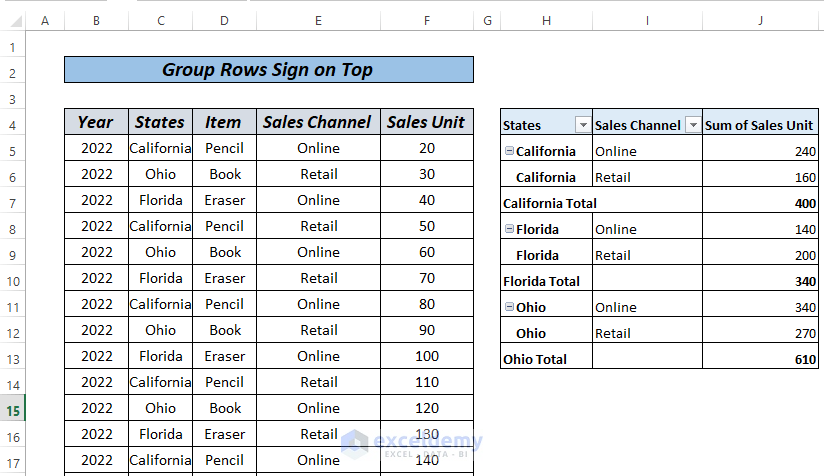
- Finally, our desired table is ready, and it looks like this.
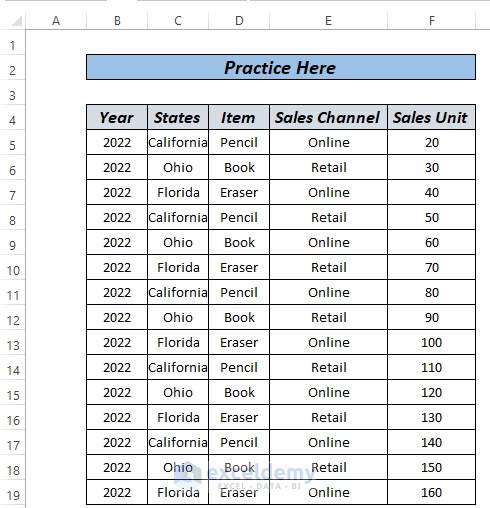
Practice Section
The single most crucial aspect in becoming accustomed to these quick approaches is practice. As a result, we’ve attached a practice workbook where you may practice these methods.
Download Practice Workbook
Conclusion
That’s all for the article. These are 2 different methods for Excel group rows with plus sign on top. Based on your preferences, you may choose the best alternative. Please leave them in the comments area if you have any questions or feedback.
Related Articles
- How to Group Rows in Excel with Expand or Collapse
- How to Group Rows in Excel by Name
- How to Group Columns Next to Each Other in Excel
- How to Group Rows with Same Value in Excel
- How to Group Rows in Excel
<< Go Back to Group Cells in Excel | Outline in Excel | Learn Excel
Get FREE Advanced Excel Exercises with Solutions!
