Below, we have a dataset containing Member ID, Joining Date, Name, State, Designation, and Member Type. We will outline or group these data based on Member Type criteria.
What Does Outlining (Group) Data Mean in Excel?
Outlining or grouping data is an action in Microsoft Excel that allows you to set up and layout your spreadsheet by grouping rows or columns together. It is very helpful when working with a large number of data in different categories. The outlining tool is useful for constructing hierarchical structures, summarizing data, and increasing worksheet readability.
If you see the GIF below, you will understand the concept better. The data on the table are outlined or grouped based on the Member Type (Premium, Local, and Platinum).
How to Prepare Your Worksheet Before Outlining or Grouping Data
If you intend to outline or group data in Excel, the first thing you need to do is prepare your worksheet. You can outline rows, columns, or both. Here, we have followed some rules to prepare our worksheet before outlining or grouping data.
- The values of the last three columns (State, Designation, and Member Type) will be used to outline or group data.
- Each column has a label or header in the first row.
- We have consecutively entered similar data in one column.
- The cells must have values because we cannot outline or group data if the cells are empty.

How to Group or Outline Rows Using Subtotal in Excel
What Is the Subtotal Feature in Excel?
The Subtotal command will be greyed out if you are dealing with an Excel table. To add subtotals to a table, first convert it to a regular range of data and then add the subtotal. Please remember that this will eliminate all table functionality from the data except for table formatting.
Steps:
To apply the Subtotal feature,
- Select any cell from the required table.
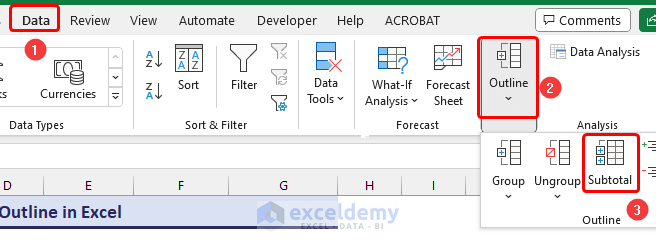
- Go to the Data tab and select Outline.
- Click on Subtotal.
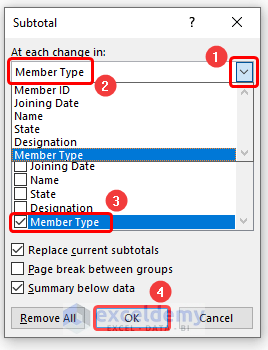
- After completing those tasks, you will get a dialogue box named Subtotal.
- From the drop-down ribbon, select Member Type as we want to outline or group data based on the Member Type.
- Click on OK.
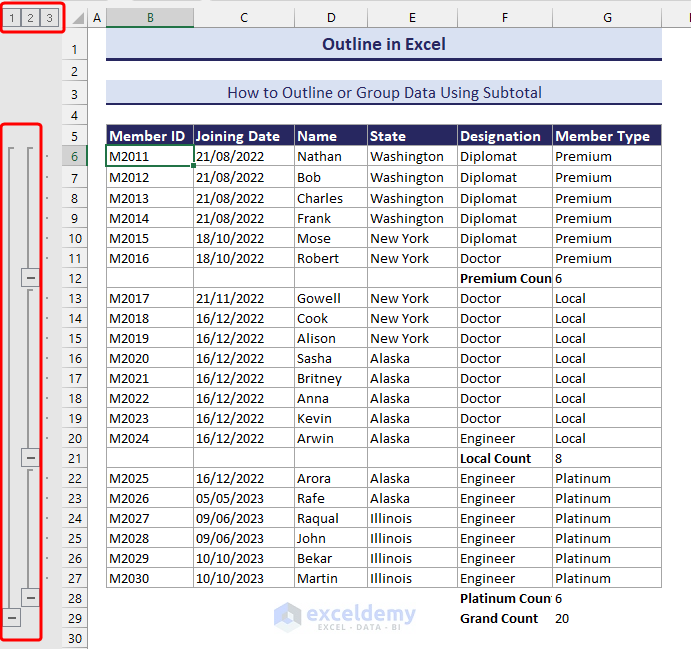
- The table has been grouped or outlined.
- To display the detailed data within a group, click the button for the group or press ALT+SHIFT+=.
- If you want to hide the outlined data, press ALT+SHIFT+-.
- Similar operations can be done by symbols.
Check out the following GIF.

How to Create an Outline of Columns in Excel
Steps:
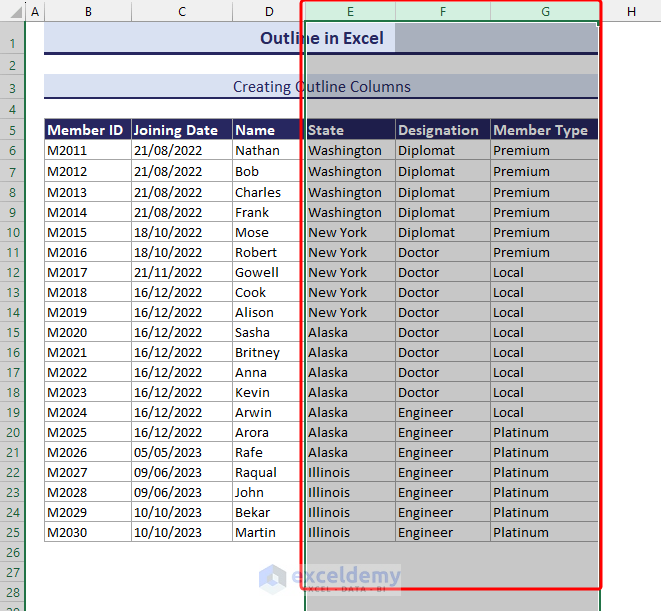
- Select a range of cells you want to outline or group.
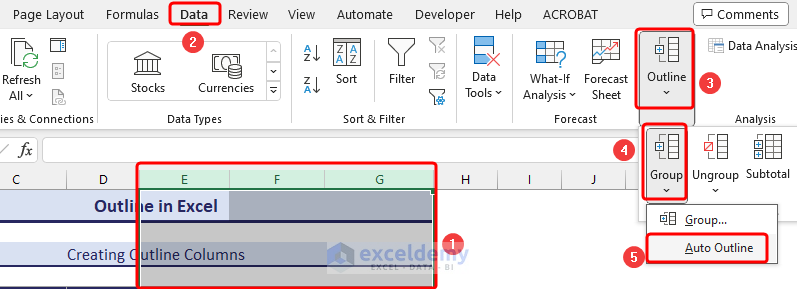
- Go to Data >> Outline >> Group >> Auto Outline.
When you click on the Auto Outline feature, you will find a message box containing Cannot create an outline.
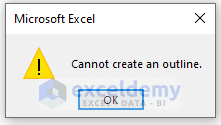
But it was not supposed to happen. The data should have been outlined or grouped. So, why it happened? It happened because there are no numeric values containing formulas in the table. All the values that are to be grouped or outlined are textual. To operate Auto Outline, you must put numeric values with formulas in the table.
Now you need to click another option.
- Go to Data >> Outline >> Group >> Group.
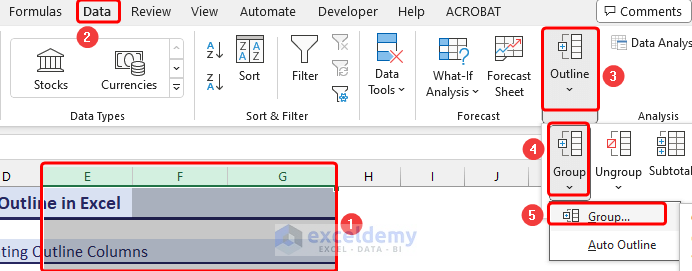
You will find the columns outlined as required.
Note: Users can also construct nested outlines in Excel. This implies you can group data that is related to your present groups.
What Is Auto Outline Feature in Excel & How Does It Work?
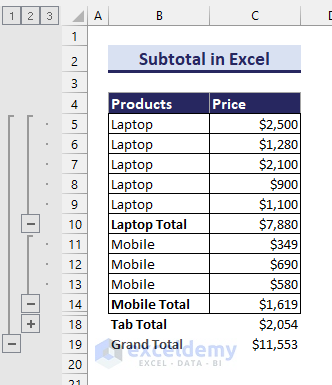
You can apply Auto Outline when working with numerical data, specifically numerical data with formulas. If you observe the following example, you will understand the function of Auto Outline better.
The example below calculates the total prices of the laptop, mobile, and tablet using formulas. Then, when the Auto Outline feature is applied, the data is outlined based on the prices of the products.
How to Outline or Group Data in a Pivot Table
You can outline or group data in PivotTable. A Pivot Table is an effective instrument for calculating, summarizing, and evaluating data that allows you to see similarities, patterns, and trends. PivotTables behave differently depending on the platform on which you run Excel.
Steps:
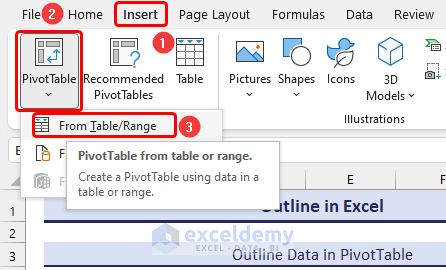
- Go to the Insert tab.
- Then PivotTable >> From Table/Range.
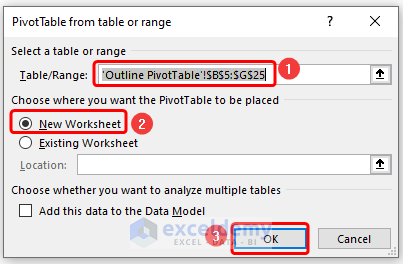
- You will get a dialogue box named PivotTable from the table or range. Do the required operations and click on OK.
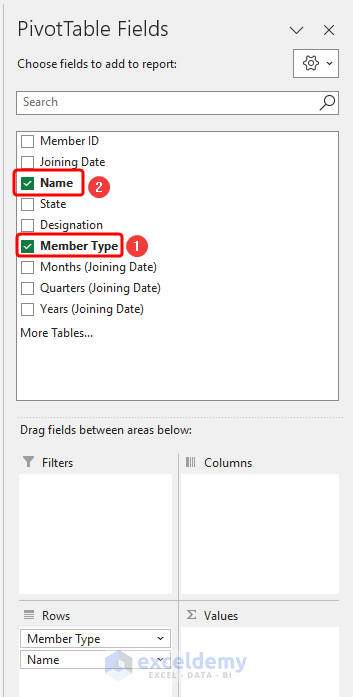
- You will find the PivotTable Fields option on the right side of the sheet.
- Check the Member Type box and then Name.
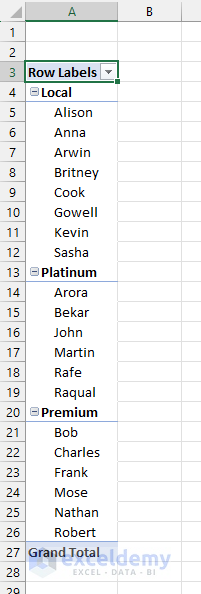
You will see that the names are grouped or outlined according to the Member Type.
You can also choose another field, apart from Member Type, to group or outline data.
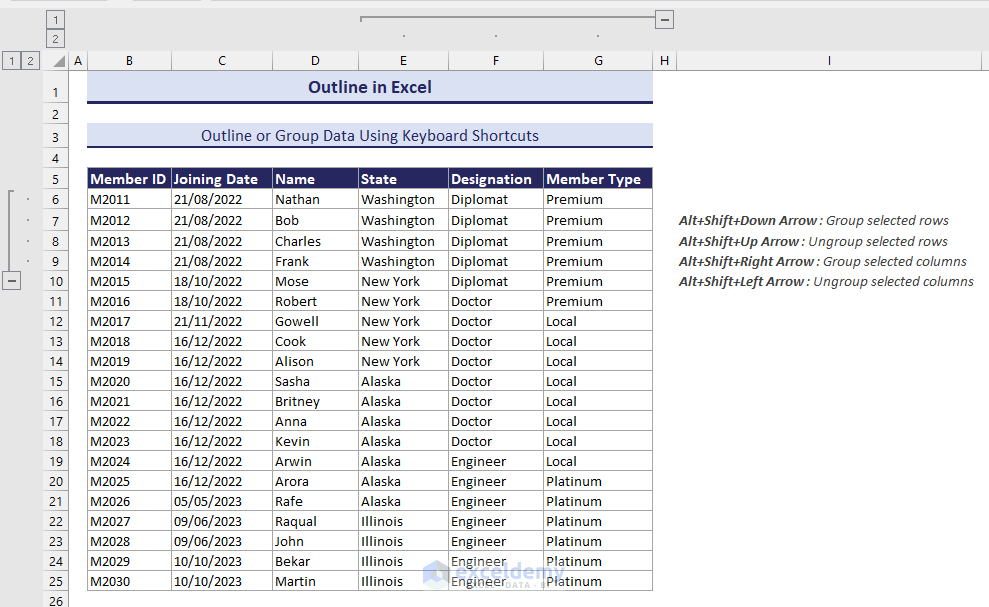
Keyboard Shortcuts for Outlining Data in Excel
You can use keyboard shortcuts to outline data in Excel. Select the range of cells you want to outline or group and then press the following keys.
- Alt+Shift+Down Arrow (⬇️) to group selected rows.
- Alt+Shift+Down Arrow (⬆️) to ungroup selected rows.
- Alt+Shift+Right Arrow (➡️) to group selected columns
- Alt+Shift+Left Arrow (⬅️) to ungroup selected columns.
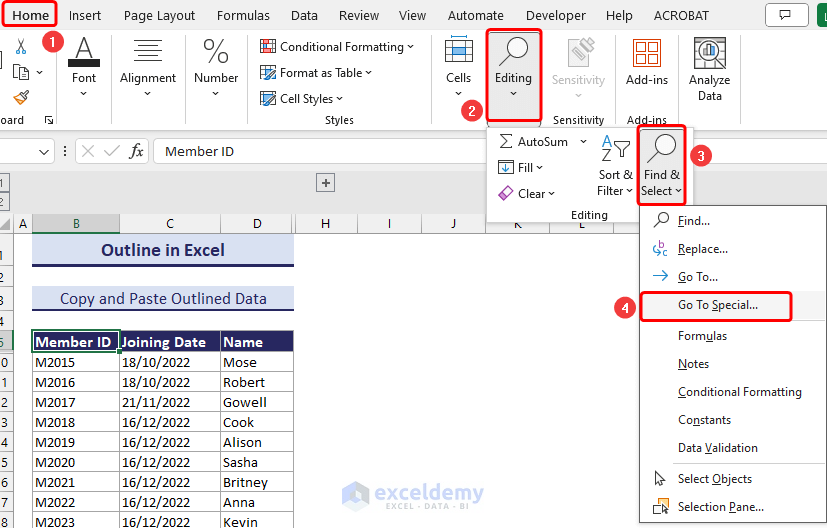
How to Copy Outlined Data in Excel
Steps:
- Go to the Home tab.
- Click on Editing >> Find & Select >> Go To Special.
- You will find a dialogue box named Go To Special.
- Check on Visible cells only and click on OK.
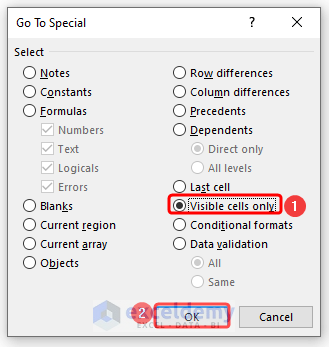
- Enter the data you want and go to the desired sheet. Only the visible values have been copied and pasted to the required sheet.
How to Ungroup Data or Remove Outline in Excel
Steps:
- Select the range of cells you want to ungroup.
- Go to the Data tab.
- Click on Outline >> Ungroup >> Ungroup. This will help you ungroup or remove outlined data in Excel.
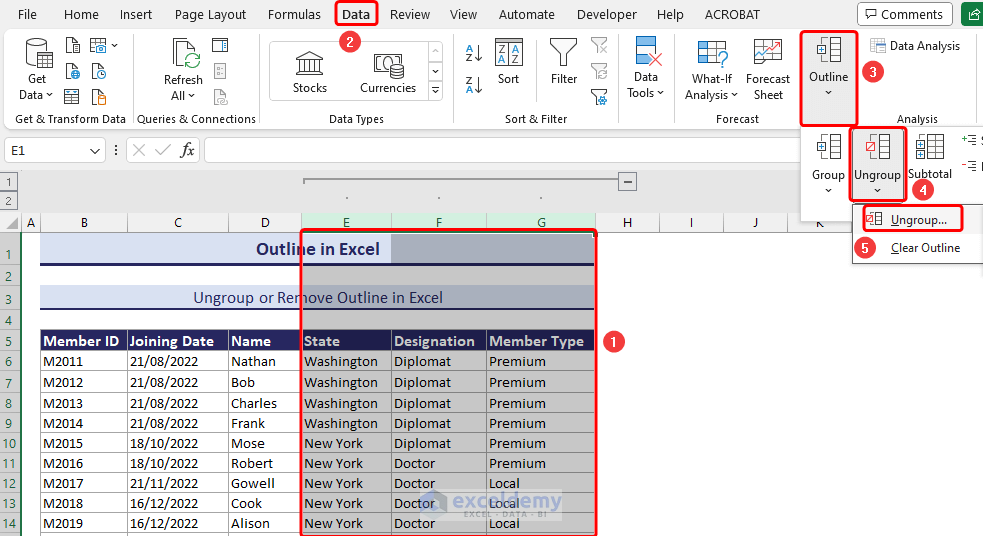
Note: Since we don’t have numerical values with formulas, we don’t need to click on Clear Outline; rather, we need to select Ungroup, as there are textual values.
How to Create a Summary Report in Excel with the Help of Outlined Data
Steps:
- Select the totals you want to make the summary report.
- Go to the Insert tab.
- Select Chart and click on 2-D Column.
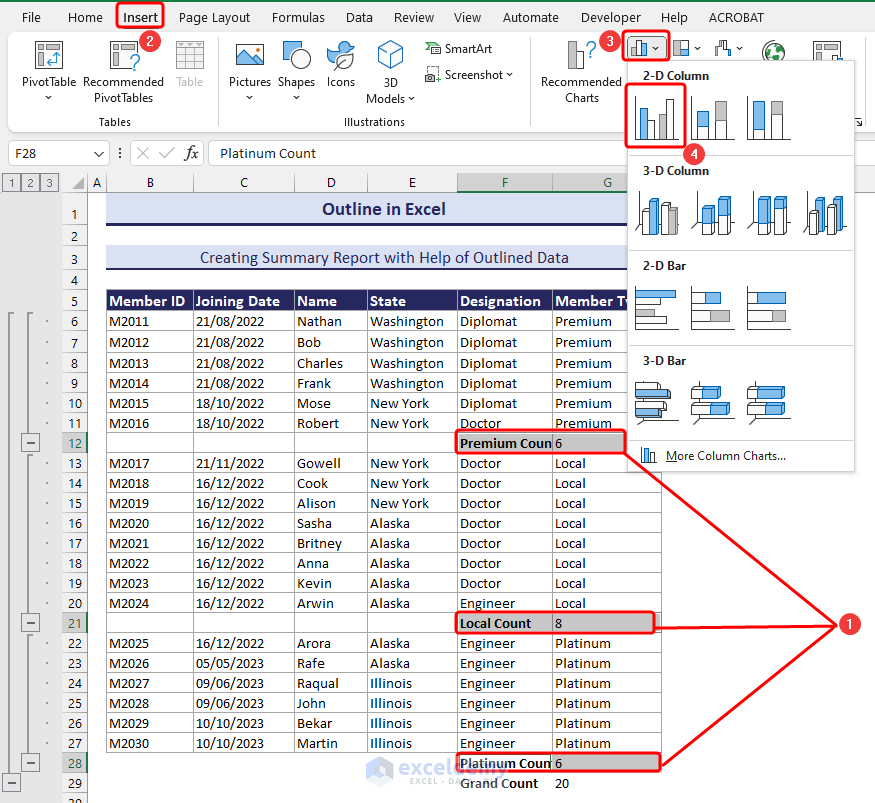
You will get the desired summary report based on the totals of your data.
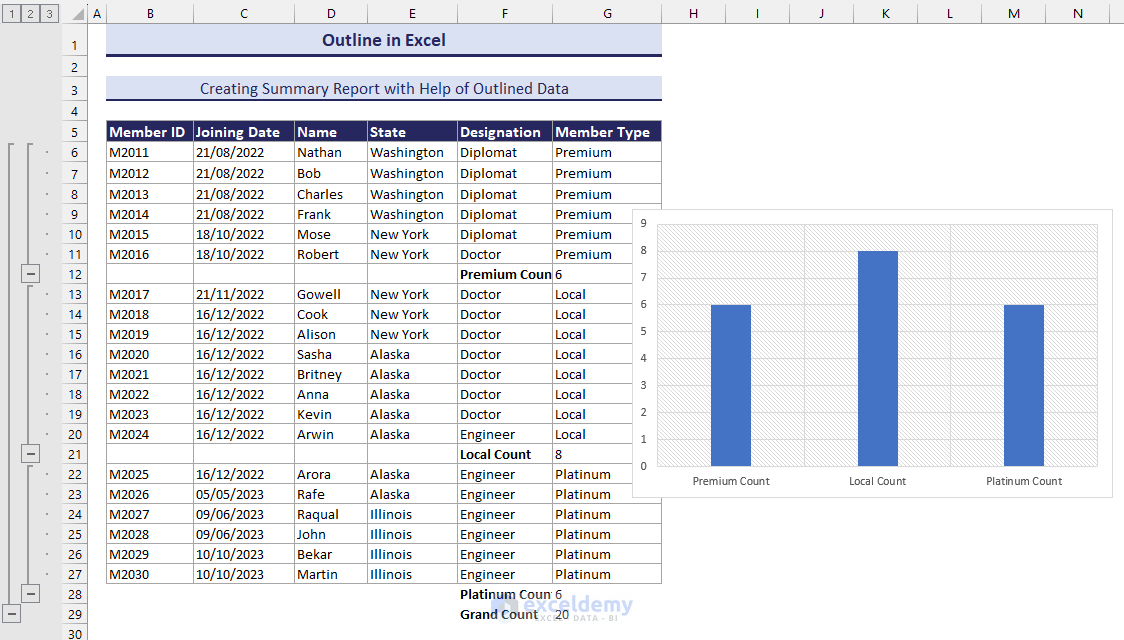
Here, we have used a 2-D column chart to display the summary report. You can also use another type of chart.
What Are Common Mistakes While Creating & Working with Excel Outline?
- Data grouping too much at once is one common problem. This may make the worksheet harder to read and cause Excel to operate more slowly.
- If you accidentally forget to label, it will be a big problem when outlining data in Excel. To ensure that other people can comprehend your data, always carefully identify your outlines.
- Be careful not to unintentionally erase or collapse crucial information. Always verify before making any significant edits to your outlines.
Download the Practice Workbook
You can download the workbook to practice.
Get FREE Advanced Excel Exercises with Solutions!

I don’t have the Data => Outline option described in the section on how to group text columns when the auto-outline option returns the message “cannot create outline.”
What can I do?
Hello Ann,
Sorry to hear your issue. If the Data >> Outline options are missing or the auto-outline feature shows “Cannot create outline,” it usually happens because the worksheet structure isn’t ready for outlining. Try these steps:
1. Check if the sheet is protected:
Go to Review >> Unprotect Sheet (if available).
2. Remove merged cells in the area you want to group:
Outlining doesn’t work when merged cells exist in the outline range.
3. Ensure there is a clear hierarchy of summary rows or columns:
Excel needs at least one subtotal/summary row to detect the outline structure automatically.
4. Try manual grouping instead of auto-outline:
Select the rows/columns you want → Data >> Group.
5. Check if you are using Excel Web or a limited version:
Some outline features aren’t fully available in Excel for the web or older versions.
If none of these help, feel free to share a screenshot of your dataset layout in our ExcelDemy Forum. The issue is usually with structure rather than Excel itself.
Regards,
ExcelDemy