What Is Mean Deviation?
Mean Deviation is a statistical measure of variability. It is calculated as the average of the absolute deviations of the data from the mean.
Arithmetic Formula to Calculate Mean Deviation
The mean deviation can be calculated as the mean deviation from the mean or the mean deviation from the median. If in your calculation the arithmetic mean is subtracted from the individual values then it is called the mean deviation from the mean. If the subtracted item is the median then it is called the mean deviation from the median. The formulas for calculating the mean deviation are given below.
Mean Deviation from Mean
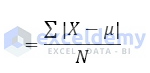
Where,
- X is each observation
- μ is the arithmetic mean
- N is the total number of observations
Mean Deviation from Median
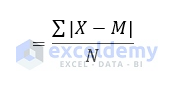
Where,
- X is each observation
- M is the Median of the observations
- N is the total number of observations
What Is Standard Deviation?
Standard Deviation is a statistical measure of dispersion, or how spread out data is. It is calculated as the square root of the variance. The variance is the average of the squared differences from the mean. Its symbol is σ (the greek letter sigma).
Arithmetic Formula to Calculate Standard Deviation
To calculate the standard deviation, you need to calculate the variance first as the standard deviation is the square root of the variance. The standard deviation can be of 2 kinds. They are population standard deviation and sample standard deviation. The formula for calculating the standard deviation is given below.
Population Standard Deviation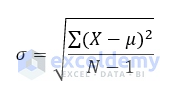
Sample Standard Deviation
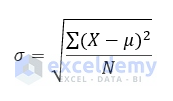
For both equations,
- μ is the arithmetic mean
- X is the individual value
- N is the size of the population
- σ is the standard deviation
Basic Examples to Calculate Mean and Standard Deviation in Excel
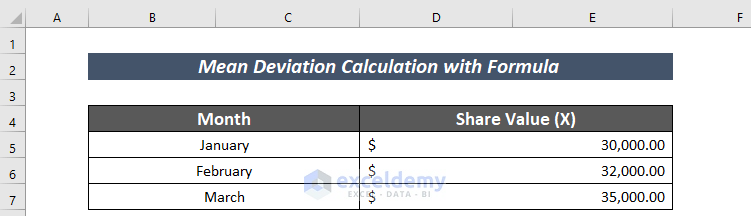
Example 1 – Mean Deviation Calculation with Formula
Steps:
- Organize your dataset.
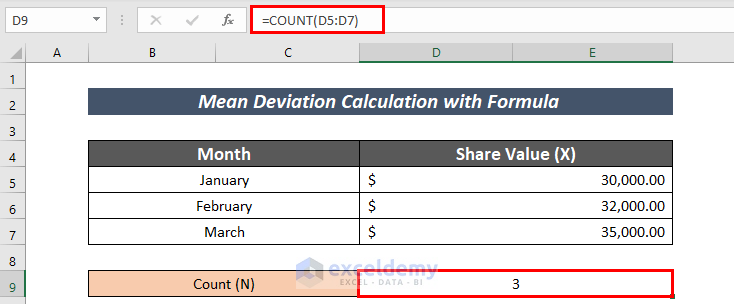
- Apply the following formula to count the number of values.
=COUNT(D5:D7)The COUNT function counts the number of values in cell D5:D7.
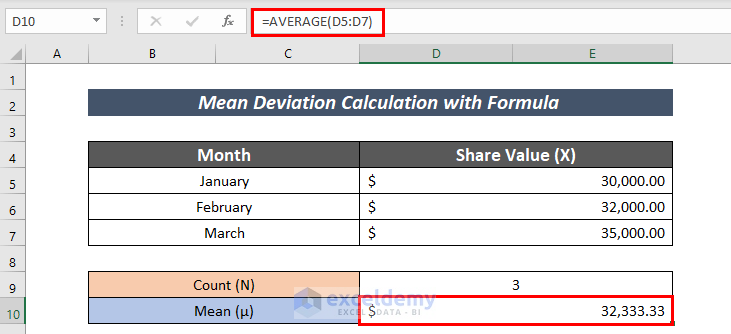
- Enter the following formula to calculate the Mean.
=AVERAGE(D5:D7)The AVERAGE function calculates the mean in the range D5:D7.
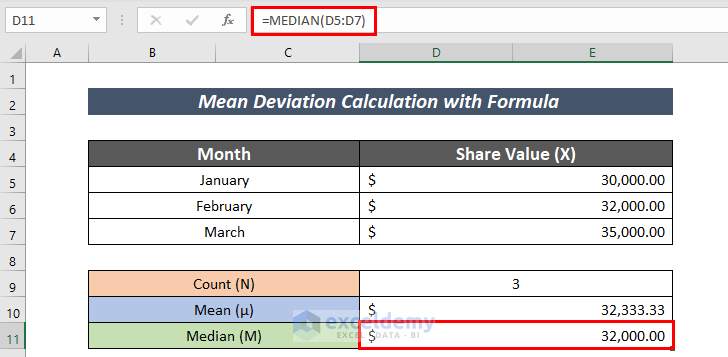
- Calculate the Median using the following formula:
=MEDIAN(D5:D7)The MEDIAN function calculates the median in the range D5:D7.
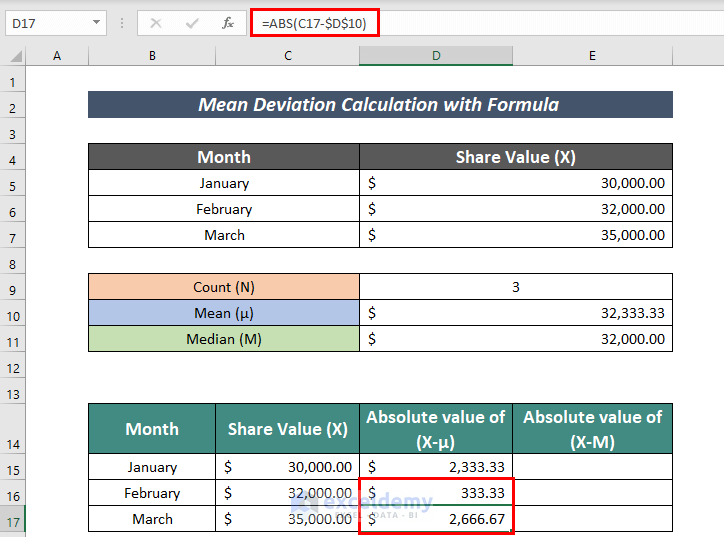
- Calculate the absolute value of the difference between the share value and the mean value.
=ABS(C15-$D$10)C15 = Share value
D10 = Mean Value
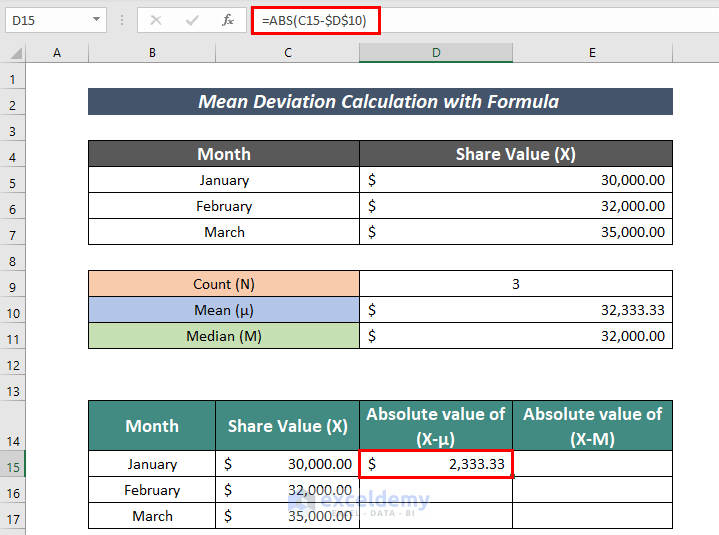
- Use Fill Handle to AutoFill the rest of the cells.
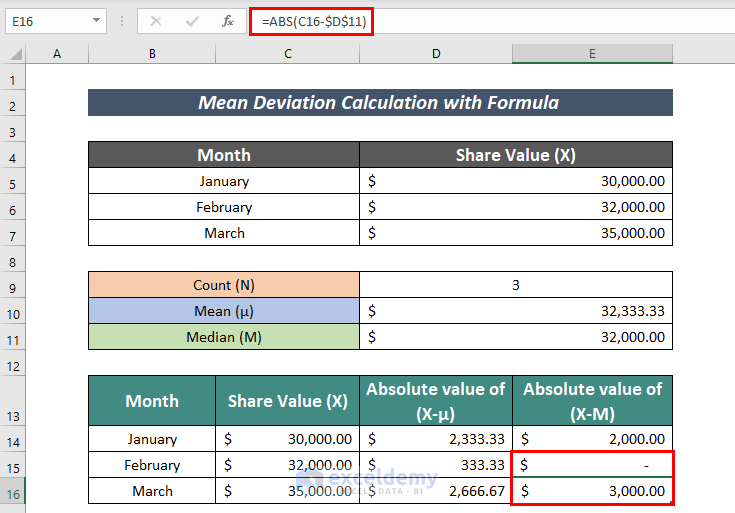
- Calculate the absolute value of the difference between the share value and the median value.
=ABS(C14-$D$11)C14 = Share value
D11 = Median Value
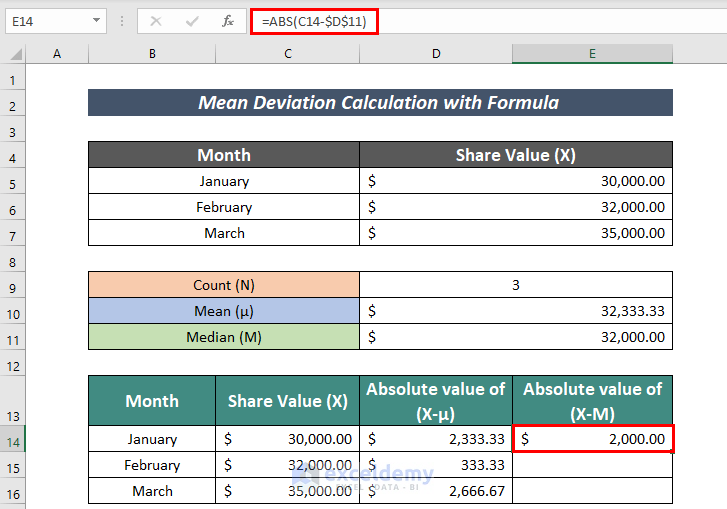
- AutoFill the remaining cells.
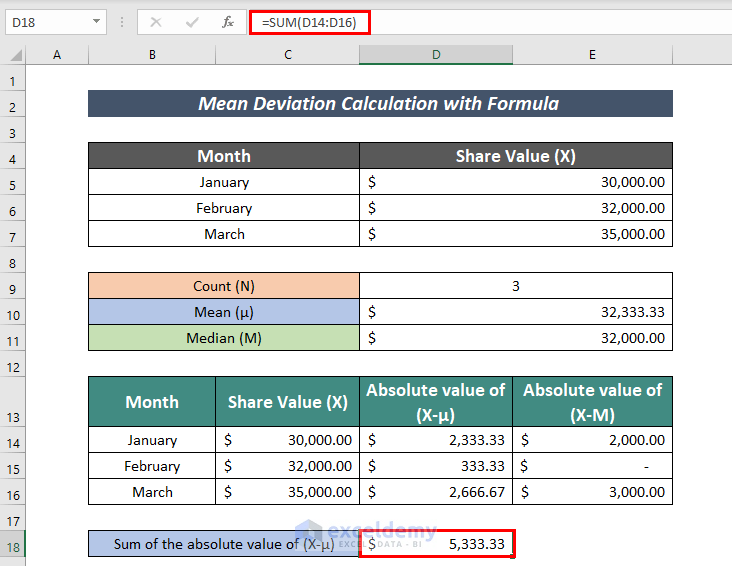
- Calculate the Sum of the absolute value of (X-μ) with the formula:
=SUM(D14:D16)The SUM function adds the value in the cells D14:D16.
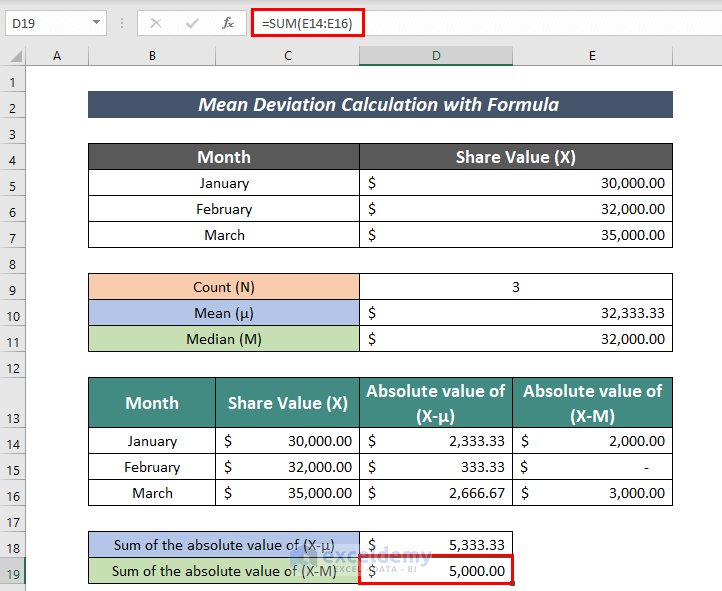
- Calculate the Sum of the absolute value of (X-M) using the formula below:
=SUM(E14:E16)The SUM function adds the value in the cells E14:E16.
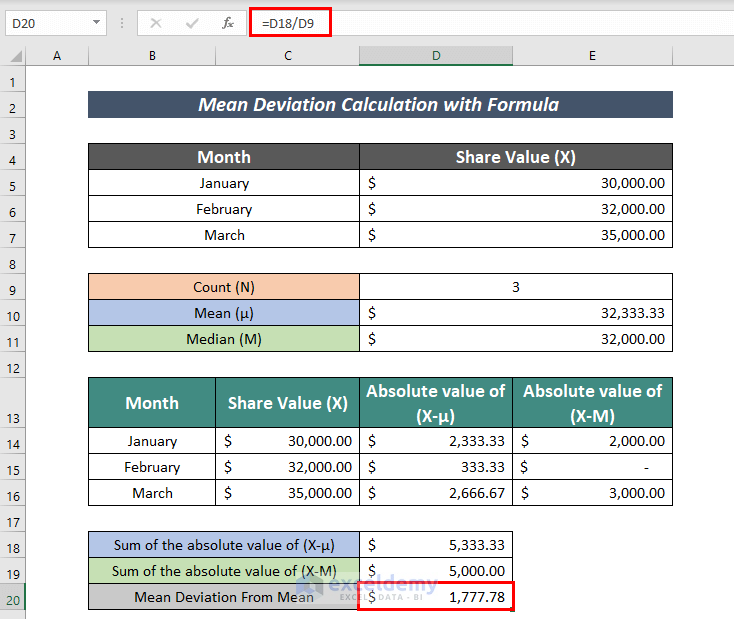
- Apply the following formula to calculate Mean Deviation From Mean:
=D18/D9D18 = Sum of the absolute value of (X-μ)
D9 = Number of Share Values
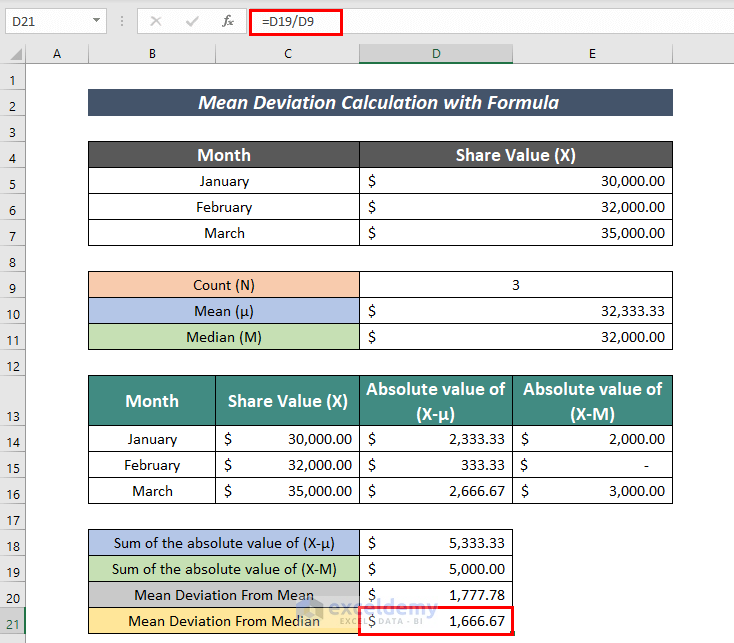
- Apply the following formula to calculate the Mean Deviation from the Median:
=D19/D9D19 = Sum of the absolute value of (X-M)
D9 = Number of Share Values
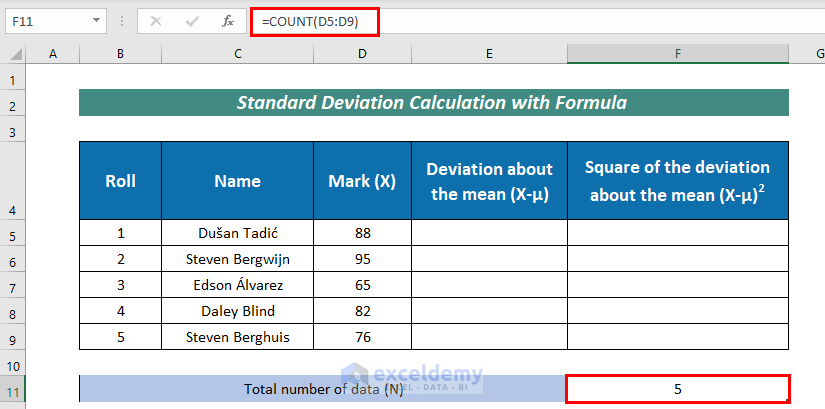
Example 2 – Standard Deviation Calculation with Formula
Steps:
- Organize your dataset.
- Apply the following formula to calculate Total number of data (N):
=COUNT(D5:D9)The COUNT function returns the number of frequencies in cell D5:D9.
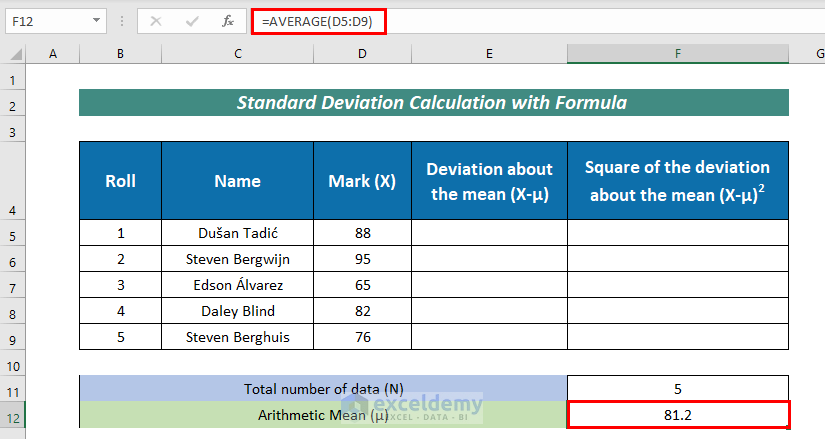
- Apply the following formula to calculate the Arithmetic Mean (μ):
=AVERAGE(D5:D9)The AVERAGE function calculates the mean in the range D5:D9.
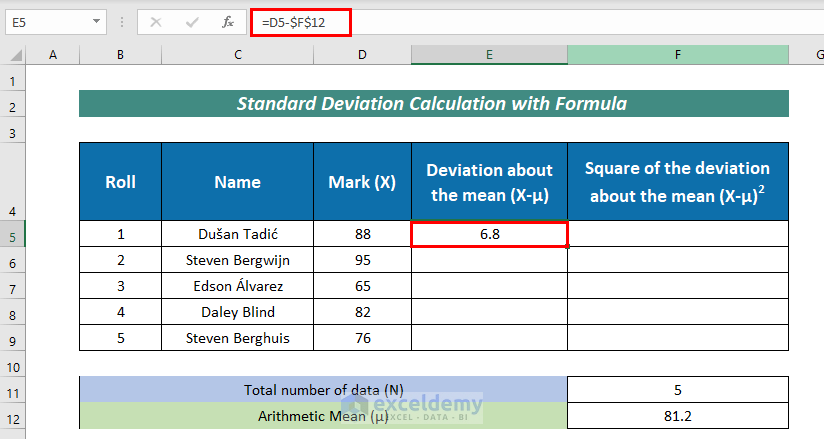
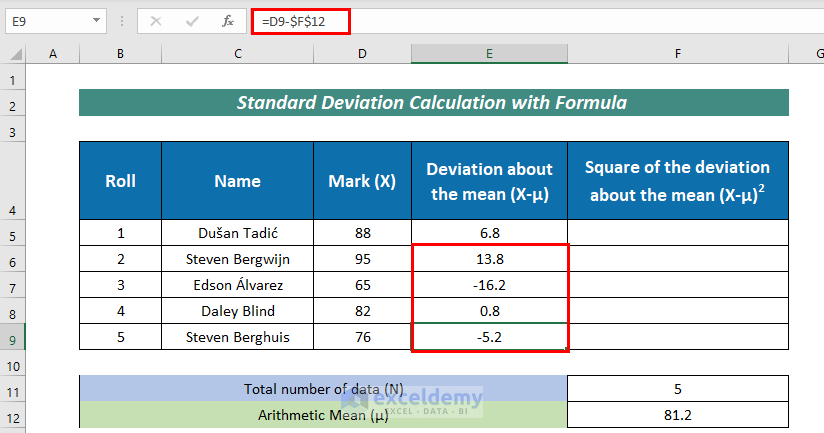
- Calculate the Deviation about the mean (X-μ) with the formula below:
=D5-$F$12D5 = frequency value
F12 = Arithmetic Mean
- AutoFill the remaining cells.
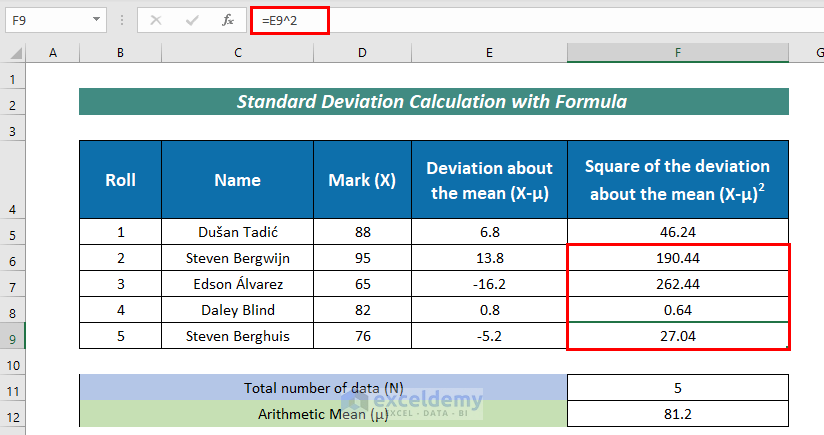
- Calculate the Square of the deviation about the mean (X-μ)^2 with the formula below:
=E5^2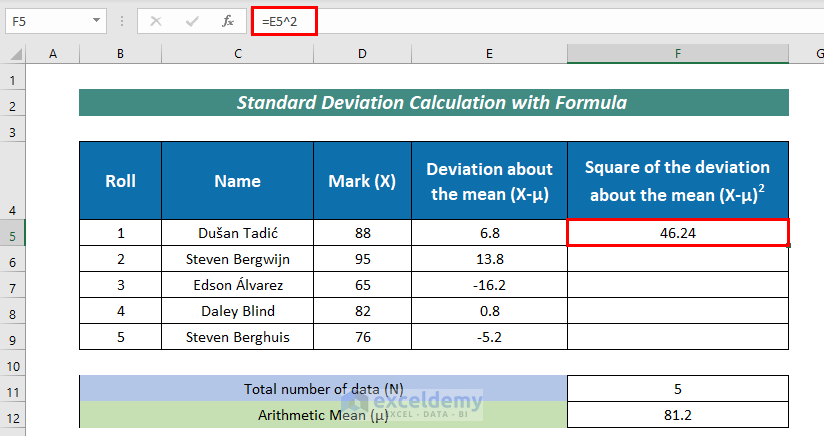
- AutoFill the remaining cells.
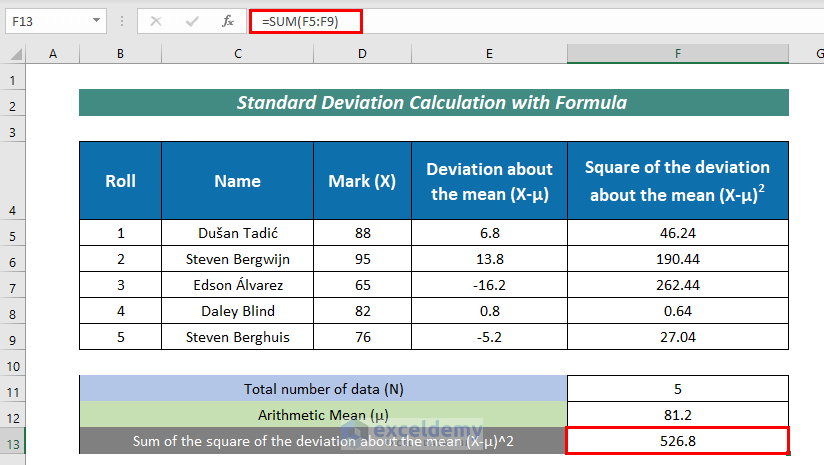
- Find the Sum of the square of the deviation about the mean (X-μ)^2 with the formula:
=SUM(F5:F9)The SUM function added the value in cells F5:F9.
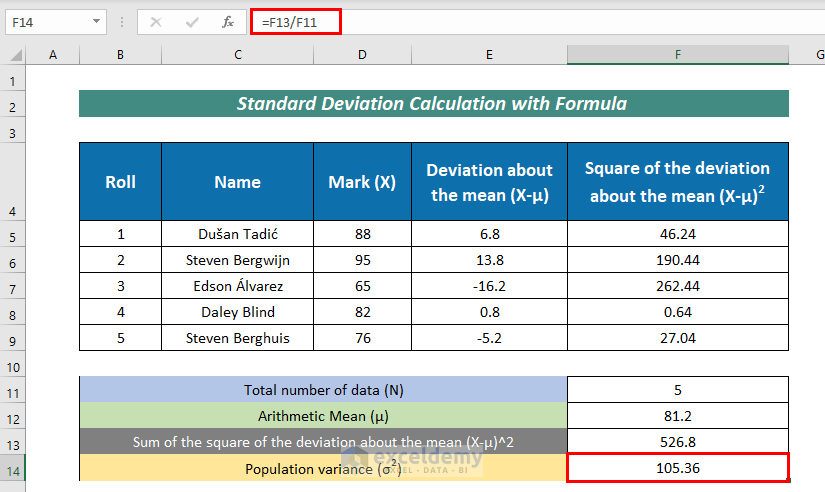
- Measure Population variance (σ^2) with the following formula:
=F13/F11F13 = Sum of the square of the deviation about the mean (X-μ)^2
F11 = Total number of data
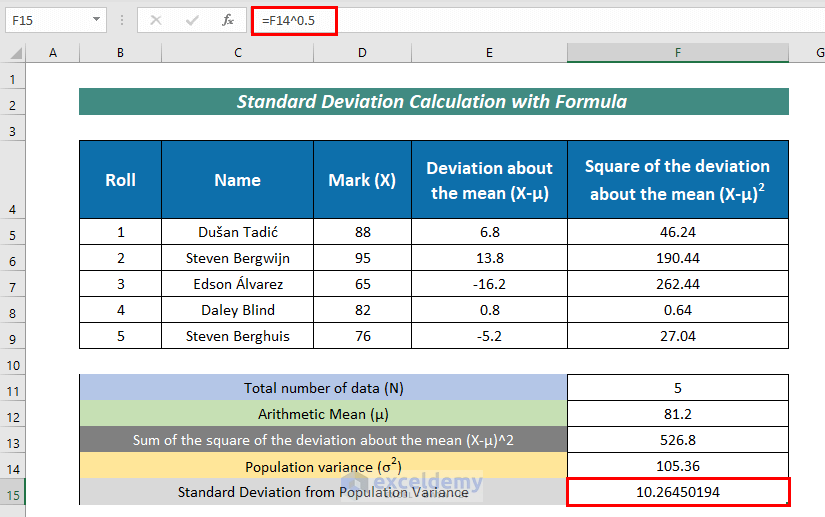
- Apply the following formula to calculate Standard Deviation from Population Variance:
=F14^0.5F14 defines Population variance.
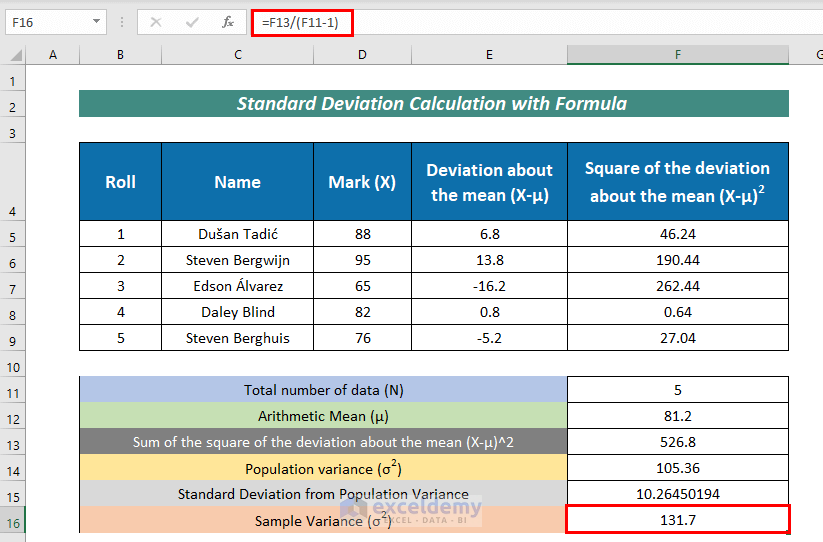
- To find Sample Variance (σ^2), enter the following formula:
=F13/(F11-1)F13 = Sum of the square of the deviation about the mean (X-μ)^2
F11 = Total number of data
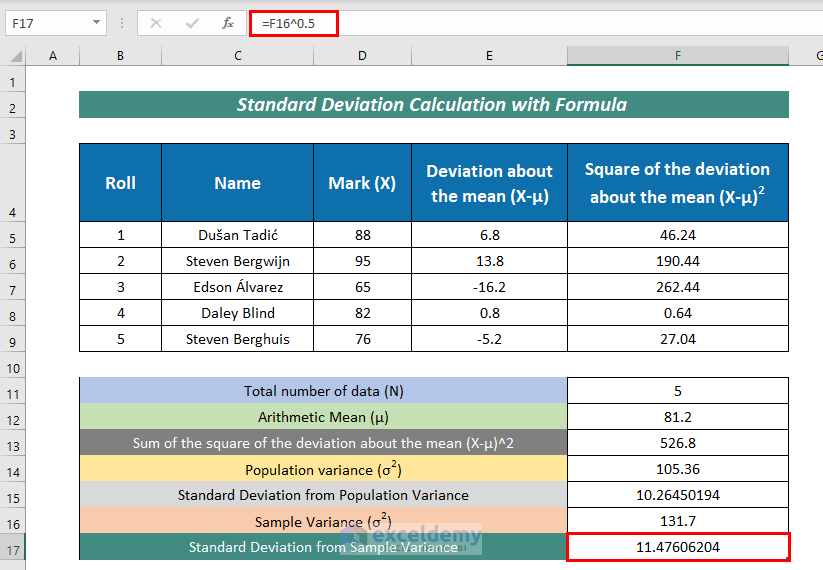
- Enter the following formula to get the Standard Deviation from Sample Variance:
=F16^0.5F16 represents Sample Variance.
Read More: How to Calculate Standard Deviation with IF Conditions in Excel
Calculating Mean and Standard Deviation Using Built-in Excel Functions
Method 1 – Mean Deviation From Mean
We can calculate the Mean Deviation From the Mean with the AVEDEV function.
The formula is:
=AVEDEV(C5:C9) 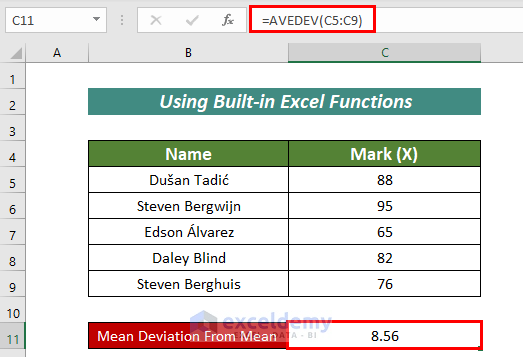
Method 2 – Population Standard Deviation
We can calculate the Population Standard Deviation with the STDEV.P function.
The formula is:
=STDEV.P(C5:C9)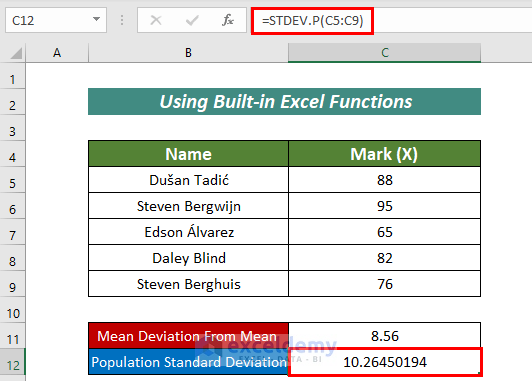
Method 3 – Sample Standard Deviation
We can calculate Sample Standard Deviation with the STDEV.S function.
The formula is:
=STDEV.S(C5:C9)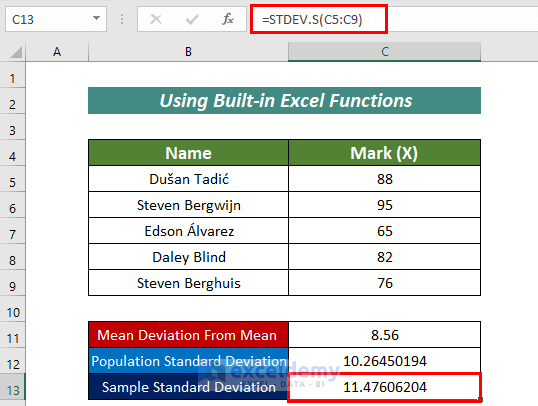
Calculating Different Types of Standard Deviations in Excel
Function 1 – STDEV.P Function
To calculate Standard deviations with the STDEV.P function, use the following formula:
=STDEV.P(D5:D9)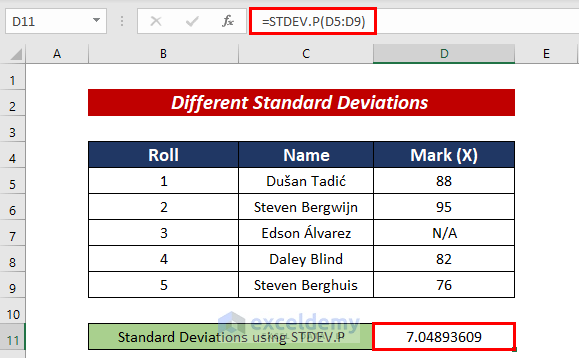
Function 2 – STDEVPA Function
To calculate Standard deviations with the STDEVPA function, use the following formula:
=STDEVPA(D5:D9)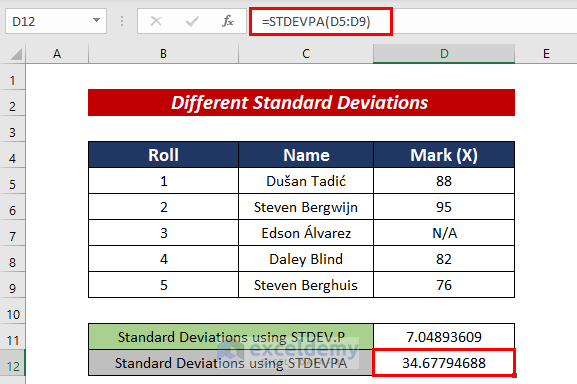
Read More: How to Calculate Standard Deviation of y Intercept in Excel
Function 3 – STDEV.S Function
To calculate Standard deviations with the STDEV.S function, use the following formula:
=STDEV.S(D5:D9)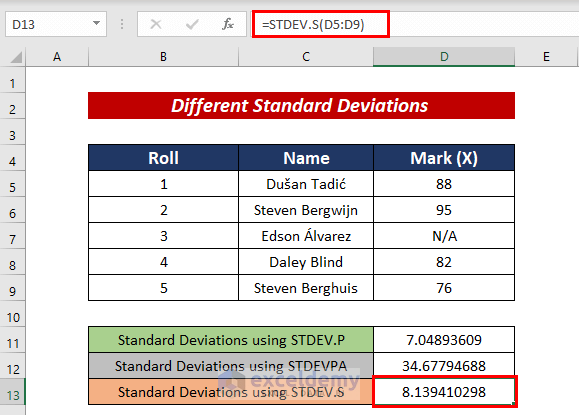
Function 4 – STDEVA Function
Using the STDEVA function to calculate Standard deviations takes into account logical values too.
Use the following formula:
=STDEVA(D5:D9)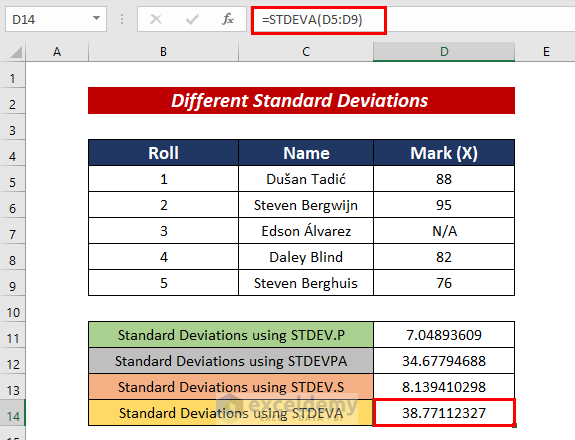
Download Practice Workbook
Related Articles
- How to Calculate Standard Deviation of a Frequency Distribution in Excel
- Calculate Percentile from Mean and Standard Deviation in Excel
- How to Calculate Uncertainty in Excel
<< Go Back to Standard Deviation Formula in Excel | Excel for Statistics | Learn Excel
Get FREE Advanced Excel Exercises with Solutions!
