If you are looking for how to calculate the percentage of budget spent in Excel, then you are in the right place. Every independent nation as well as ...
In this article, we will demonstrate anchoring the comment boxes in Excel. Anchoring comment boxes in a specific location is a tricky task. In Excel ...
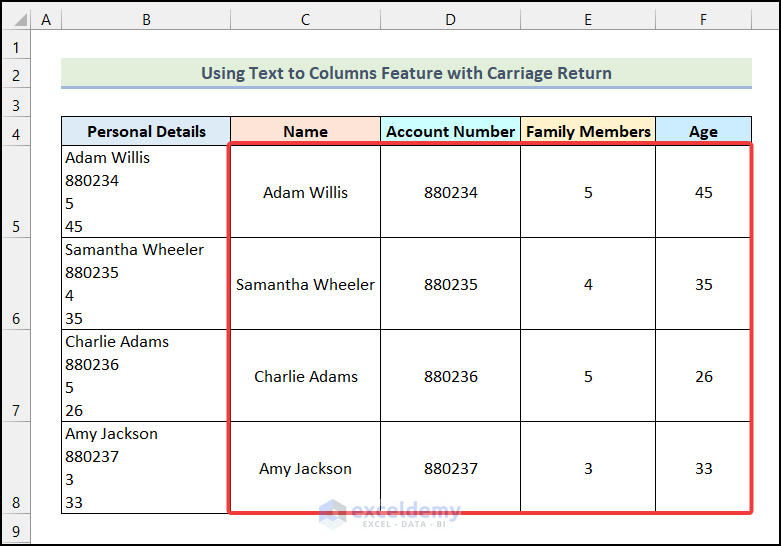
While working in Excel, we often need to use the Text to Columns feature of Excel to split data into multiple columns. In the Text to Column option, ...
Here, we will need some files instead of a data set to perform my task. We will rename the following files which all are located in the same folder.
...