Weighted moving average is one form of moving average that is used to smooth out time-series data with an aim to decrease the effects of random, short-term fluctuations and to find out the patterns and trends in the data more easily. Weighted moving average considers the current data points more important as they have more relevance than the earlier data. Hence it assigns greater weight to recent data points and less weight to earlier data points. The weighted moving average in Excel is calculated by multiplying each data point in the observation with a predetermined weighting factor.
Weighted Moving Average in Excel: 3 Suitable Methods
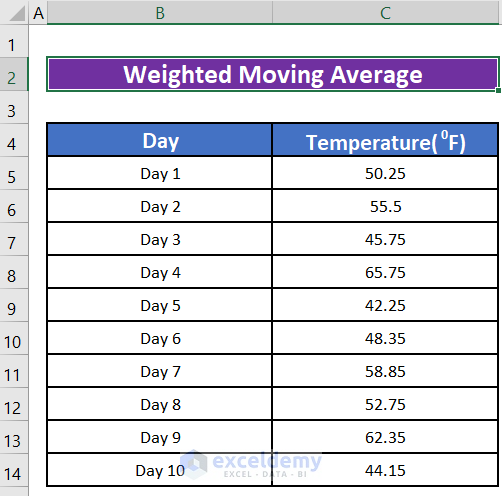
Let’s assume a scenario where we have temperatures of 10 consecutive days during the autumn season. We aim to smooth the data and to determine the temperature for the 11th day. We will use a weighted moving average to achieve our target. Weighted moving average in Excel can be calculated using three methods. In the first one, we will calculate the average while we develop the formula ourselves. We will also use the SUMPRODUCT function in Excel to calculate the weighted moving average. We will use exponential smoothing in the third one.
Here’s an Overview of Our Dataset:
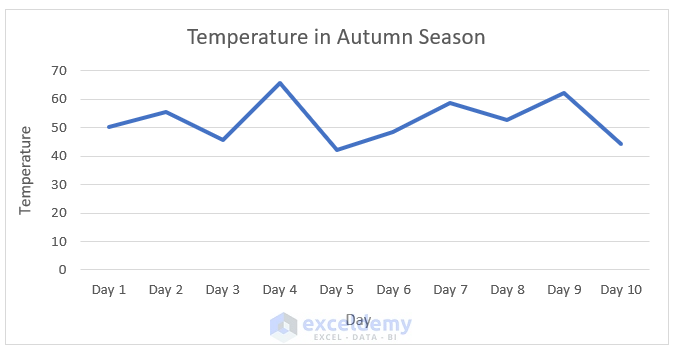
And the Visual Representation of the Dataset is this:
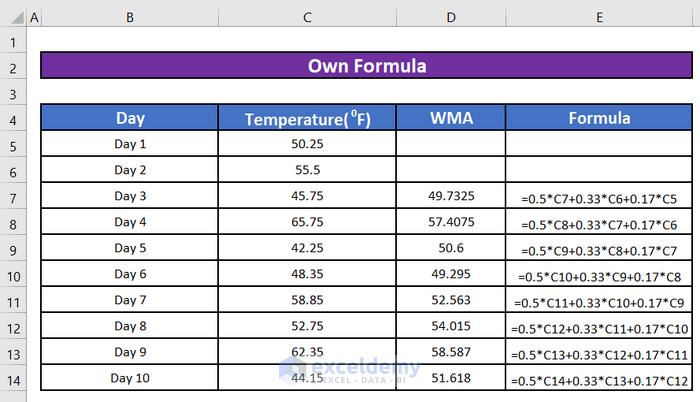
1. Calculate Weighted Moving Average Using Own Formula
Step 1:
- Our first step is to determine how many previous periods we are going to include in our calculation. We are going to include the previous three periods in our calculation. You can change the number of periods depending on their importance or relevance.
Step 2:
- We will calculate weights for our data points. An easy approach to determine weights is to use successive numbers from 1. We will divide every number by the sum of numbers to find out the percentage value that will indicate how much the number is important or relevant in calculating the weighted moving average (WMA). Use the below formula to calculate the sum of weights.
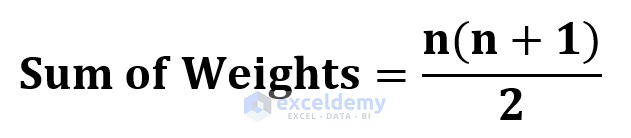
Where n = number of periods.
For example, if you calculate the weighted moving average over 3 data points, the sum will be 6 by calculating (3 * (3 + 1)) / 2.
Thus, the weights will be,
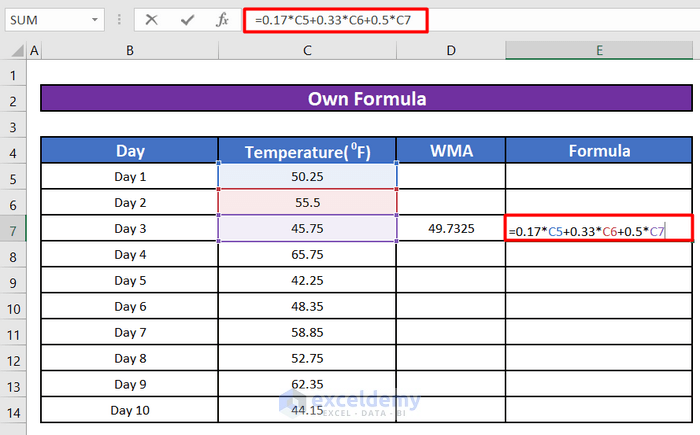
For two periods back, 1/6 = 0.17
For the period just before the current period, 2/6 = 0.33
For the current period 3/6 = 0.5
Note: The total point must add up to 1
Step 3:
- Now we will calculate the weighted moving average for each period. Column D in the image below shows that we have calculated the weighted moving average for the temperature on Day 3. column E shows the formula we have used to calculate it.
Step 4:
- We can use this formula to find out the weighted moving average for the temperature of every day.
- If we create a chart to see a visual representation of the actual temperature vs. the weighted moving average, we’ll notice that the linerepresenting weighted moving average (WMA) is relatively smoother with fewer fluctuations.

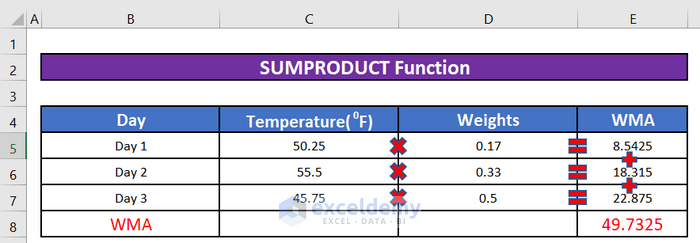
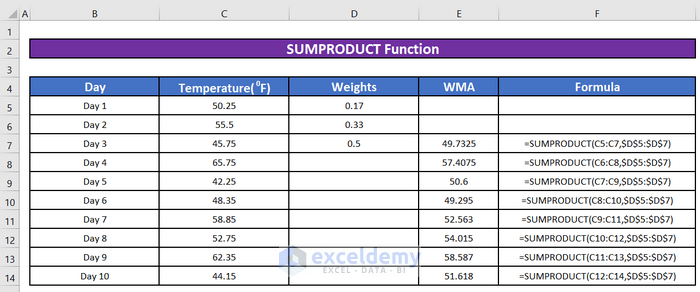
2. Calculate Weighted Moving Average Using the SUMPRODUCT Function in Excel
Excel SUMPRODUCT function multiplies the first element of the first array with the first element of the second array. Then it multiplies the second element of the first array with the second element of the second array. And so on.
And finally, it adds all these values. See the below image to understand how this function works.
To calculate the weighted moving average using this formula, we have to do the following:
Step 1:
- We will write the following formula in cell E7 under the WMA.
=SUMPRODUCT(C5:C7,$D$5:$D$7)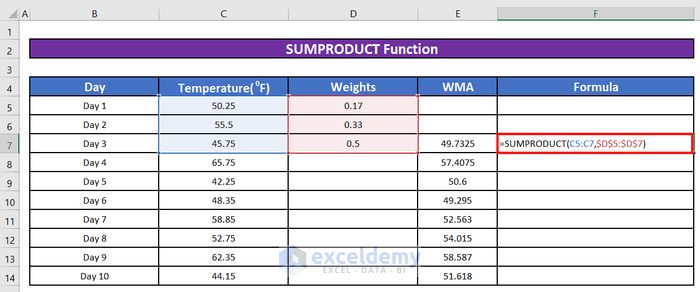
- Upon pressing ENTER, the weighted moving average for Day 3 will be calculated.
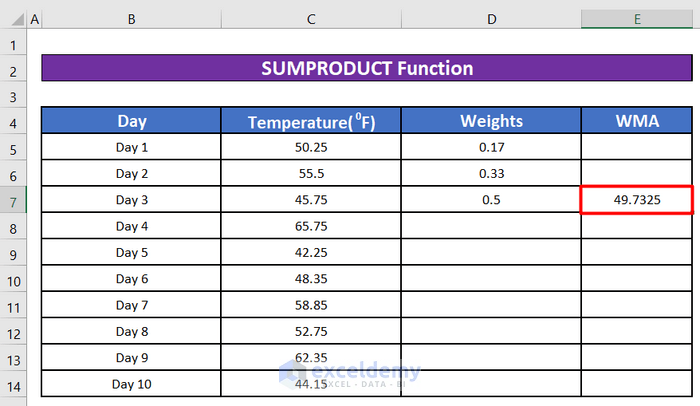
Step 2:
- We will drag the cell E7 downward using the 4-ways arrow key and the weighted moving average for the following days will be calculated.
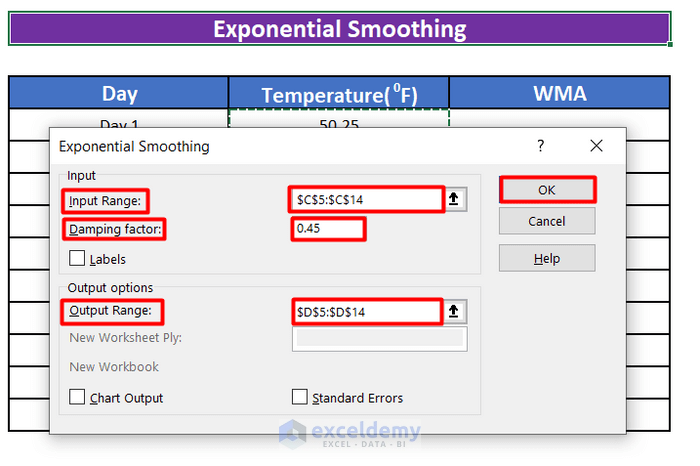
3. Calculate Weighted Moving Average Using Exponential Smoothing
The Exponential Smoothing tool in Excel calculates the moving average. However, exponential smoothing weights the values included in the moving average calculations so that more recent values have a greater effect on the average calculation and old values have a lesser effect. This weighting is accomplished through a smoothing constant.
Step 1:
- To calculate the weighted moving average using Exponential Smoothing, first, click the Data tab’s Data Analysis
Note: If the Data Analysis command is not available in your version of Excel, check the Things to Remember section below.

- When Excel displays the Data Analysis dialog box, select the Exponential Smoothing from the list and then click OK.

Step 2:
- Now when Excel displays the Exponential Smoothing dialog box, enter the data range C5:C14 in the input range either by typing worksheet range address or by selecting the worksheet range.
- Provide a smoothing constant in the Damping factor input box. The Excel Help file suggests that you use a smoothing constant of between 0.2 and 0.3. We will enter 45 as the Damping factor or smoothing constant.
- Select the range D5:D14 as the Output Range where you want to store the weighted moving average values.
- Press the OK button.
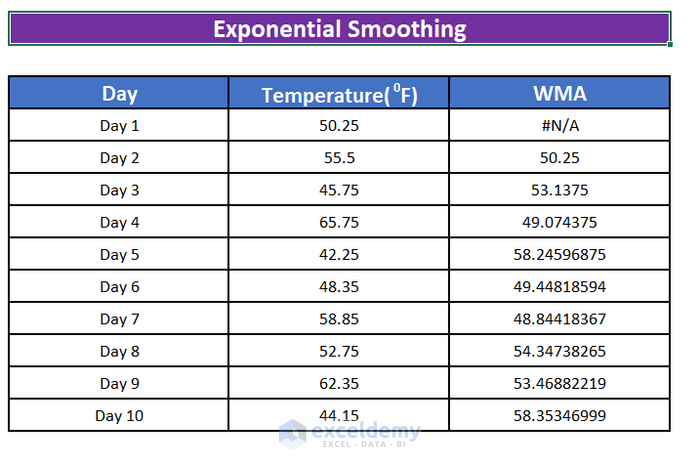
Step 3:
- Upon pressing ENTER, the weighted moving average for 10 days will be calculated.
- We will create a line chart to visualize the actual temperature vs. the weighted moving average.

Things to Remember
If the Data Analysis command is not available in your version of Excel, you need to load the Analysis ToolPak add-in program. These instructions are also applicable to Excel 2010, Excel 2013, and Excel 2016.
- Click the File tab, click Options, and then click the Add-Ins category.
- In the Manage box, select Excel Add-ins and then click Go.
- In the Add-Ins available box, select the Analysis ToolPak check box and then click OK.
Tip: If you do not find Analysis ToolPak in the Add-Ins available box, click Browse to locate it.
If you get a prompt box saying Analysis ToolPak is not currently installed on your computer, click Yes to install it.
Once you have installed the add-in successfully you will see data analysis when you click on the data tab (usually to the far right of the toolbar).
Download Practice Workbook
Download this practice book to exercise the task while you are reading this article.
Conclusion
In this article, we have learned to calculate the weighted moving average with our developed formula and using the SUMPRODUCT function and the Exponential Smoothing tool of Excel. If you have any queries or recommendations about this article, please leave a comment below. Have a great day!!!
Related Articles
- Assigning Weights to Variables in Excel
- How to Calculate Weighted Average with Percentages in Excel
- Calculate Weighted Average Price in Excel
- Calculate Conditional Weighted Average with Multiple Conditions in Excel
<< Go Back to Weighted Average Excel | How to Calculate Average in Excel | How to Calculate in Excel | Learn Excel
Get FREE Advanced Excel Exercises with Solutions!
