NPV Break Even analysis is one of the most widely used tools to understand a business procedure and important indicator to shape future investment. In this article, we are going to present a simple step-by-step procedure where you can learn to get the unit of product needed to produce in order to do NPV break-even analysis in Excel.
NPV Break Even Analysis Overview
By NPV break-even, we can figure out how many units of a product or service must be sold for a business to make money. In other terms, the study shows how many sales requires to cover operating expenses. The break-even analysis establishes the number of sales required to cover all fixed costs for the business. A seller’s selling powers would be enlightened by a demand-side study. The mathematical expression of the break even unit/point is:
BEQ=FC/(P-VC)
Where,
BEQ = Break Even Quantity/Unit
FC = Fixed Cost
P = Price per Unit
VC = Variable Costs per Unit
⏩ Assumptions of Break-Even Analysis
- Fixed costs and variable costs can be used to categorize the total costs. Semi-variable cost is ignored.
- The revenue and cost functions continue to be linear.
- It assumes that the product’s pricing will never change.
- Sales volume and manufacturing volume are equal.
- Over the volume being considered, the fixed costs are constant.
- Variable cost escalation is assumed to be constant.
- It assumes that technology will never change and that labor productivity won’t increase.
- This will not affect the Factor price.
- Price changes for inputs are taken as zero.
- Its product mix is steady for multi-product businesses.
Read More: How to Do Multi-Product Break-Even Analysis in Excel
Step-by-Step Procedure of NPV Break-Even Analysis in Excel
Here we are going to use the below data of a business entity to conduct the break-even analysis. To avoid any kind of compatibility issue, use the Microsoft Excel 365 edition.
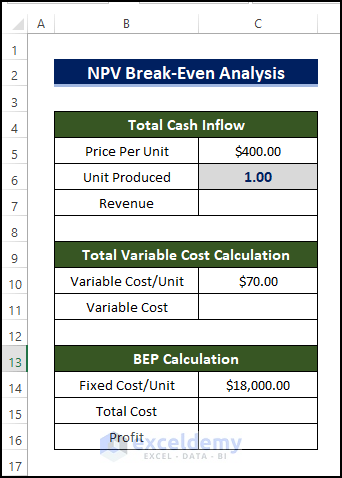
STEP 1: Calculate Total Cash Inflow
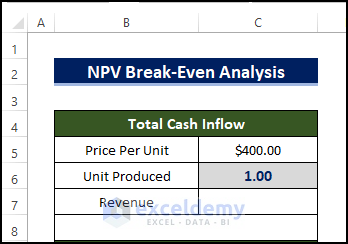
Before we delve into calculating the NPV break-even unit. We need to fix and set up the structure or complete the basic structure of product calculation. We will have to calculate the cash inflow from the products first.
- We first need to calculate the total cash flow into the business by calculating the revenue stream of the product.
- For this, we need to input the unit price of products.
- Initial unit set to 1.
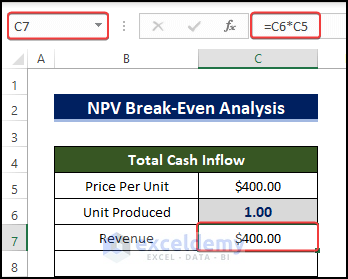
- After then we can find the total Revenue by multiplying the Price per unit by the Unit Produced.
- For this, select cell C7 and enter the following formula:
=C6*C5
Read More: How to Calculate Break-Even Analysis with Formula in Excel
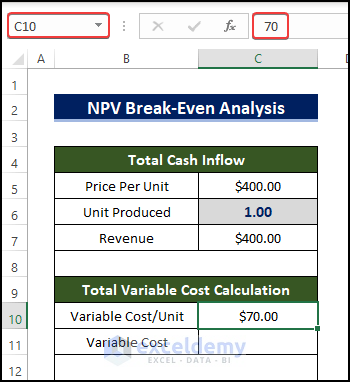
STEP 2: Determine Total Variable Cost
After calculating the total cash inflow, we will calculate the variable cost of producing the products.
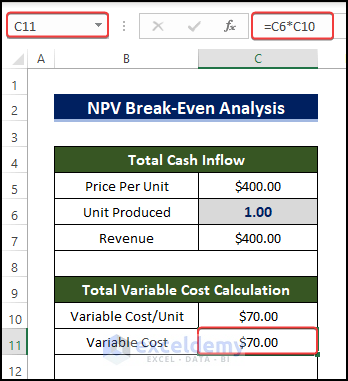
- To calculate the variable cost, we need to calculate the variable cost per unit in cell C10.
- To calculate the total variable cost, select the cell C11 and enter the following formula:
=C6*C10
- After pressing enter, you will see that the total variable cost is now present.
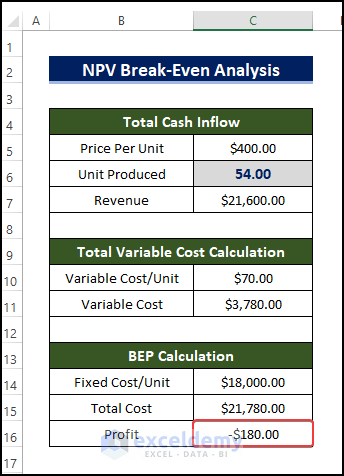
STEP 3: Compute Profit
As we already managed to estimate both the revenue and all the costs, we can proceed to calculate the profit.
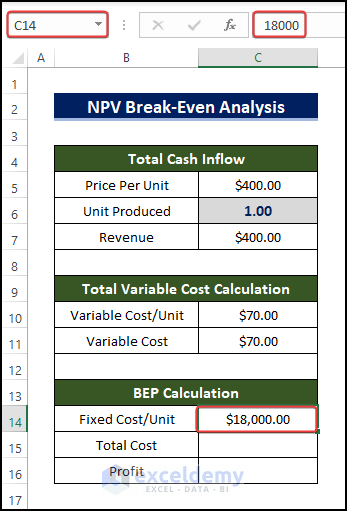
- We input the total Fixed Cost in cell C14.
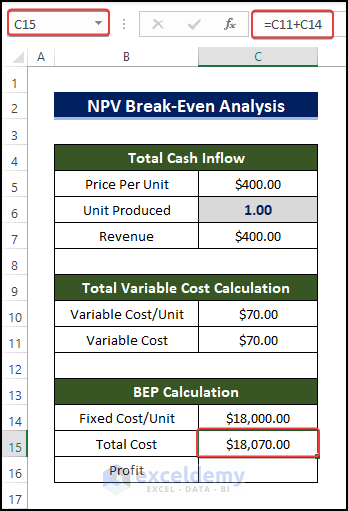
- Then we calculated the Total Cost by selecting the cell C15 and entering the formula:
=C11+C14
- Then we can calculate the Total Profit by selecting the cell C16 and entering the following formula:
=C7-C15
- Pressing enter afterward will give us the output of Total Profit.
STEP 4: Use Goal Seek Tool for NPV Break Even Analysis
We completed the calculation of profit. Therefore, we can start running the Goal Seek tool to estimate the NPV Break Even Analysis.
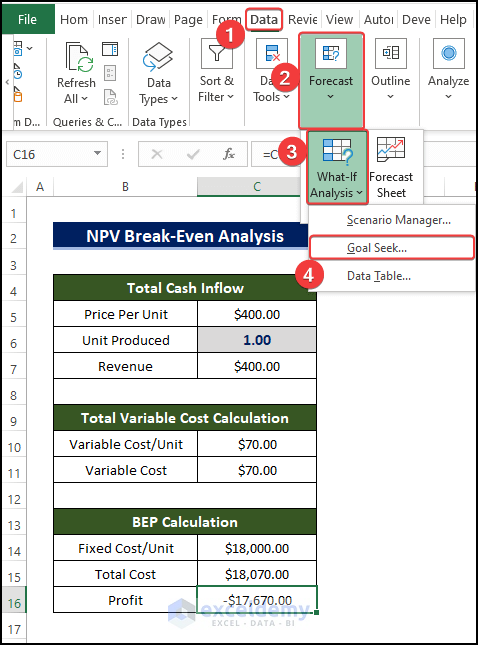
- Now we will launch the Goal Seek tool in order to optimize the cash flow.
- First, go to Data > Forecast > What If Analysis > Goal Seek.
- After pressing the Goal Seek, you will notice that there is another window open.
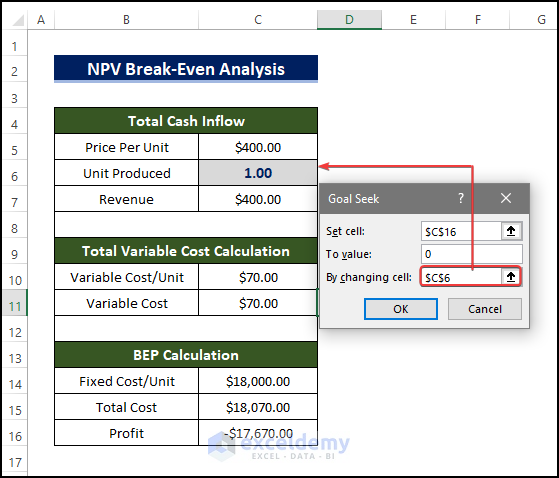
- In that window, select cell C16 in the Set cell range box.
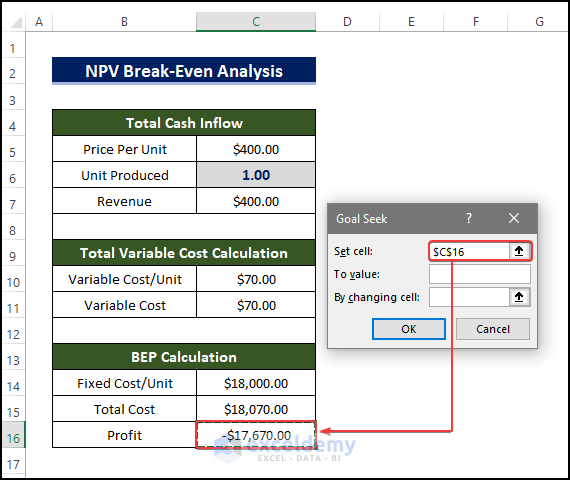
- Then in the By changing cell range box, select cell C6.
- Then set the value 0 in the To value box.
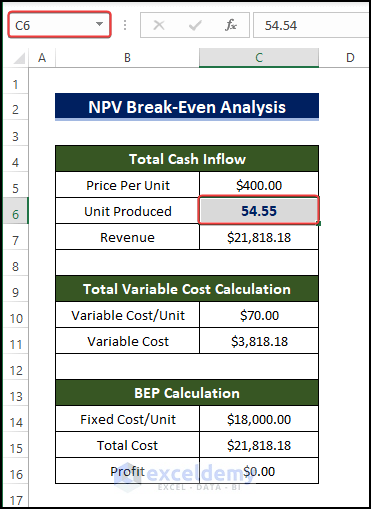
- After some loading period, you will notice that the optimum no of units produced is now showing in cell C6.
- And this is how managed to calculate the optimum unit value while keeping the profit neutral, in other words, we conducted the break-even value of this operation.
Read More: How to Do Break-Even Analysis with Goal Seek in Excel
STEP 5: Evaluate Break Even Result in Excel
Obviously, we got some results, but the results might not be in the desired format. So, we need to understand and modify the output accordingly. For example,
- The result that we have right now is in a fraction situation. So, we need to balance the value a bit.
- If we input the Unit Produced as 0, then the value will be positive 150, meaning the profit would be 150.
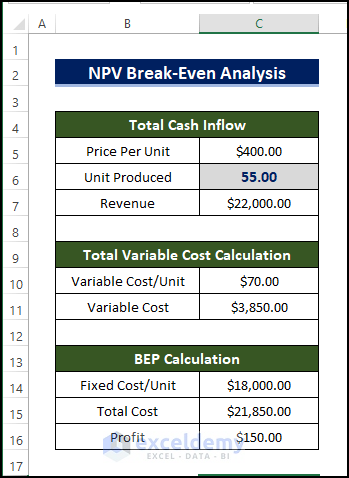
- On the other hand, if we enter integer 53 in the empty cell, then we would see that the profit value is negative.
- So, we need to select the profit value as positive other the Net Present Value won’t be as positive. Which means the Business operation will not be successful.
- So, the Final unit production optimum value is 55.
Read More: Mortgage Break-Even Analysis in Excel
Advantages and Disadvantages of Break-Even Analysis
Break-even analysis has some advantages and at the same time some caveats that all investors need to understand and remember.
⏩ Advantages
- Calculate profits and losses at various production and sales levels.
- Determine the impact of price adjustments on sales.
- Analyze how variable costs and fixed costs relate to one another.
- Determine how cost and efficiency adjustments may affect profitability.
⏩ Disadvantages
- Inside the break-even calculation, we maintain a continuous situation. This cost function is linear and the selling price is constant. It won’t be the case.
- At the break-even point, We use past functions to project the future because we maintain the function constant. That is incorrect.
- Only over a narrow range of output does the notion that the cost-revenue-output connection is linear hold true. This is not a useful tool for use over a long distance.
- Profits are a result of output as well as additional variables that remain uncounted in this analysis, such as advances in technology and management techniques.
Read More: How to Calculate Break-Even Sales with Formula in Excel
Download Practice Workbook
Conclusion
To sum it up, the issue of how we can do the NPV break-even analysis on Excel in demonstrated here in a step-by-step procedure. For this problem, a workbook is available to download where you can practice these methods. Feel free to ask any questions or feedback through the comment section.
<< Go Back To Break Even Analysis Excel | Excel For Finance | Learn Excel
Get FREE Advanced Excel Exercises with Solutions!
