Let’s use the following dataset of sales and costs for a product to conduct a break even analysis.
Download Practice Workbook
You can download the practice workbook from here.
Break-Even Analysis Formula
The break-even point satisfies the following formulas.
Where,
So, the number of units that need to be sold at the break-even point becomes.
Here,
Different Ways to Analyze Break Even Point
There are different ways to analyze the break-even point. They are:
1. Break-Even Units: How many units need to be sold at a predetermined price to reach the break-even point:
Here,
2. Break-Even Sales: This is how much you need to earn from sales to break even:
Here,
3. Break-Even Price: This is the price of the product you will need for reaching the break-even point when you know the production volume:
How to Do Break-Even Analysis in Excel
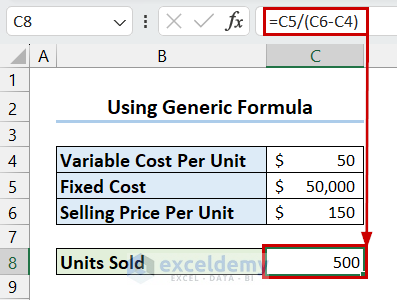
Method 1 – Use Generic Formula to Calculate Break-Even Point
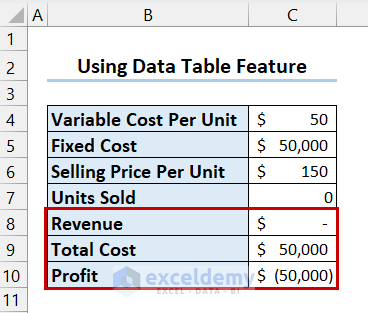
- Let’s take the sample provided as the base for calculations
- Select the cell where you want the Units Sold at the break-even point – C8.
- Write the following formula:
=C5/(C6-C4)- Press Enter to get the result.
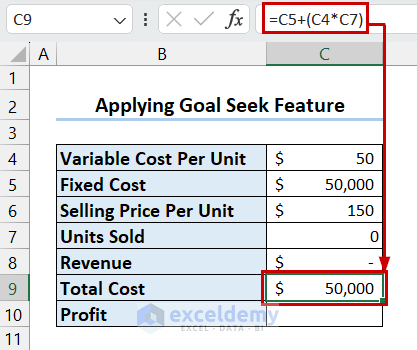
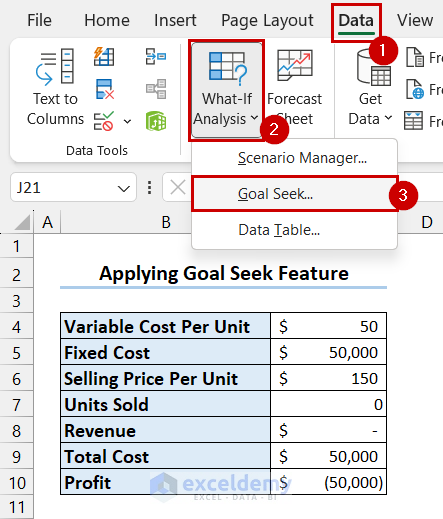
Method 2 – Apply Goal Seek Feature to Calculate Break Even Point in Excel
- Select the cell where you want the Revenue.
- Write the following formula.
=C6*C7- Press Enter.

- Select the cell where you want the Total Cost.
- Write the following formula.
=C5+(C4*C7)- Press Enter.
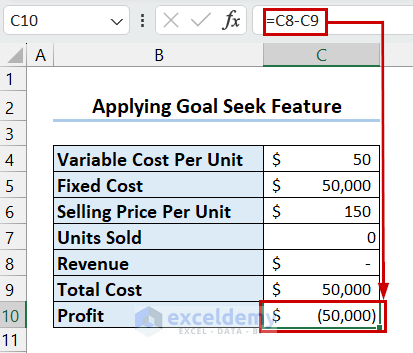
- Select the cell where you want the Profit.
- Write the following formula.
=C8-C9- Press Enter and you will get the Profit.
- Go to the Data tab.
- Select What-If Analysis.
- Choose Goal Seek.
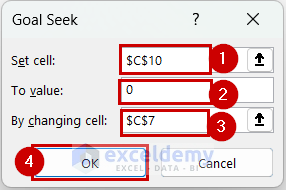
- Select the cell that contains Profit in Set cell.
- Put To value as 0.
- For By changing cell, choose a cell for Units Sold.
- Select OK.
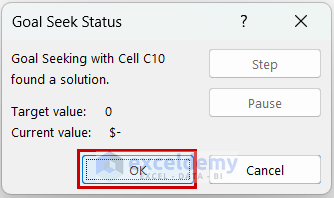
- Goal Seek Status dialog box will appear. Select OK.
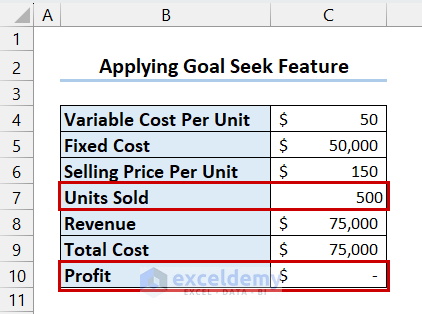
- The formula will change the Units Sold to reach the break-even point.
Method 3 – Use Data Table Feature to Find Break Even Point in Excel
- Determine the Revenue, Total Cost, and Profit cells by following the steps from the previous method.
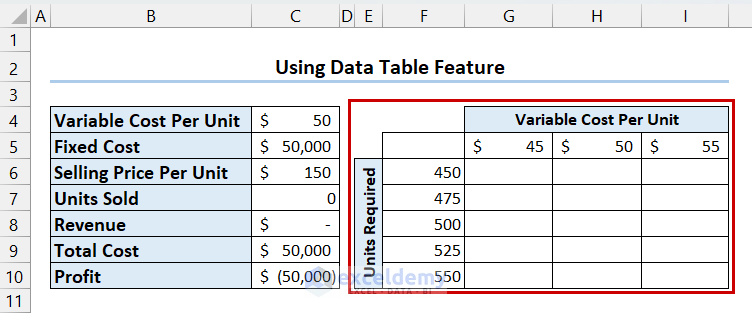
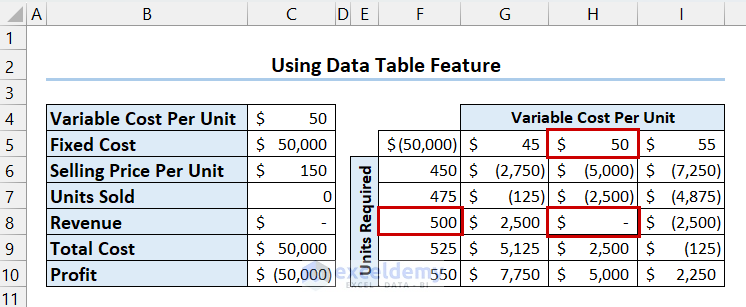
- Create a variable table like the following image, where one axis is the cost and the other is units required.
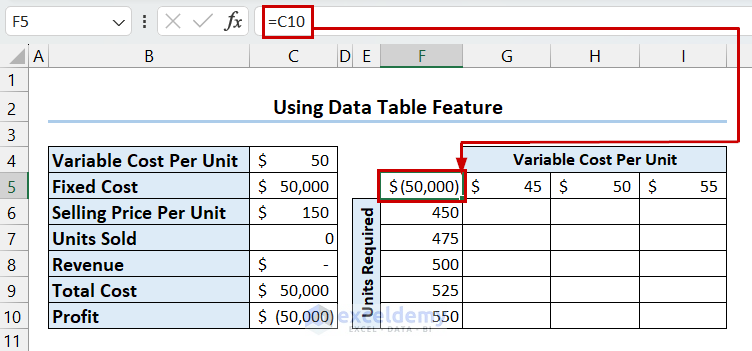
- Select the first cell of the new table at the intersection of the headers.
- Write the following formula to get the profit here:
=C10- Press Enter.
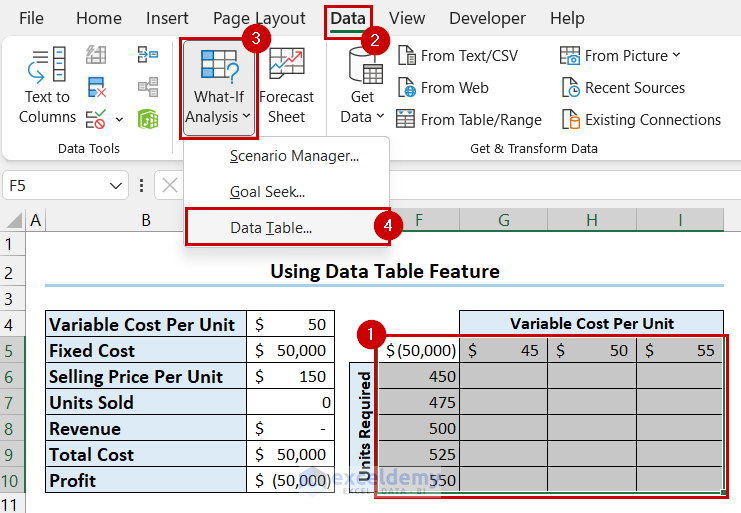
- Select the table.
- Go to the Data tab and select What-If Analysis.
- Choose Data Table.
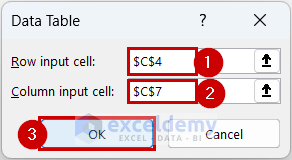
- The Data Table feature will appear.
- Select Variable Cost Per Unit from the first table as the Row input cell.
- Select Units Sold from the first table as the Column input cell.
- Select OK.
- Excell will fill in the table according to the listed variables in the headers.
- You can see that when the Variable Cost Per Unit is $50 you will need to sell 500 products to reach the break-even point. Values in parenthesis are actually negative, meaning that you’d still incur a loss at those points. For example, selling 500 units that cost $45 a piece puts you $2,500 above the goal, but each costing you $55 puts you $2,500 under.
Method 4 – Perform Break Even Analysis in Excel with Charts
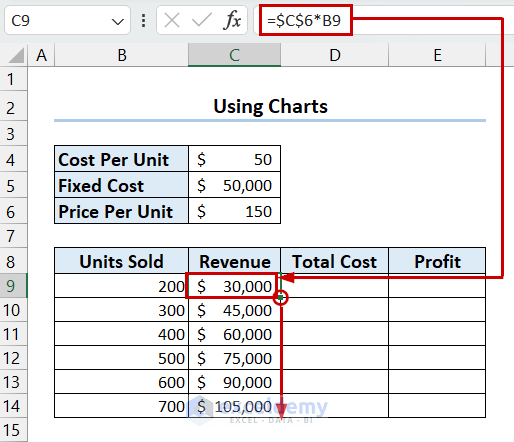
- Select the cell where you want the Revenue.
- Write the following formula:
=$C$6*B9- Press Enter and drag the Fill Handle down to copy the formula to the other cells.
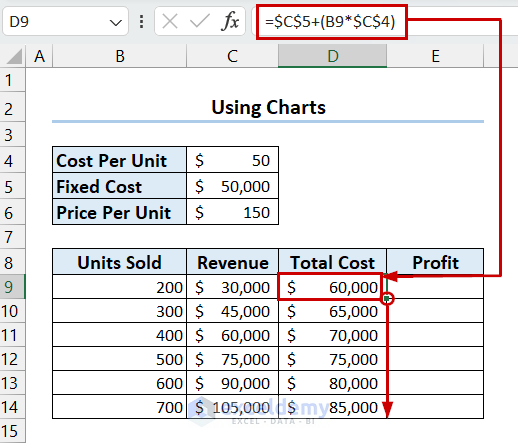
- Select the cell where you want the Total Cost.
- Write the following formula:
=$C$5+(B9*$C$4)- Press Enter and drag the Fill Handle down to copy the formula to the other cells.
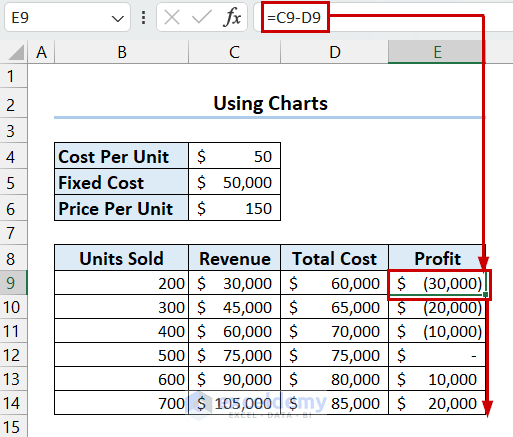
- Select the cell where you want the Profit.
- Write the following formula:
=C9-D9- Press Enter and drag the Fill Handle down to copy the formula to the other cells.
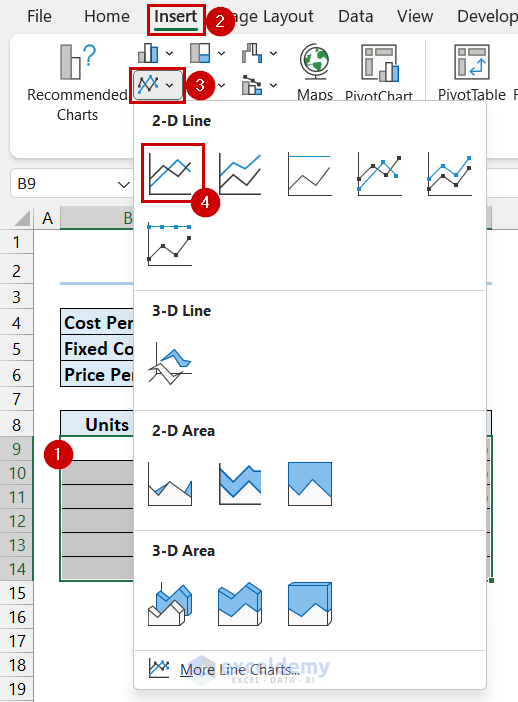
- Select the data table you created for the chart.
- Go to the Insert tab.
- Choose Insert Line or Area Chart.
- Select Line.
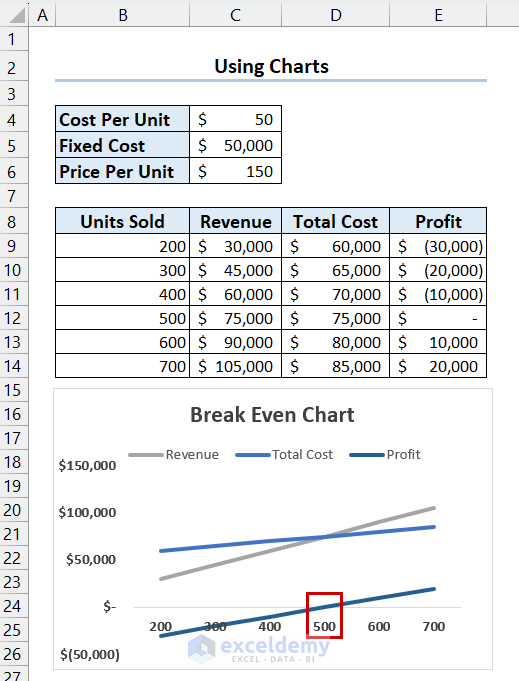
- You will see the estimated break-even point in the chart.
Break Even Analysis Template in Excel
Step 1 – Create Section for Product Details
- Create a section for Product Details and fill up the section with information about the product.

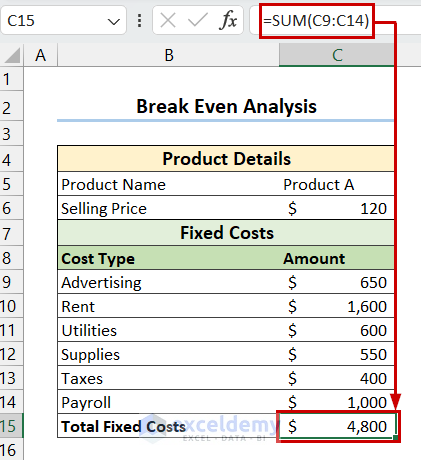
Step 2 – Calculate Fixed Cost
- Create a section for Fixed Costs and fill that section with the information you have.
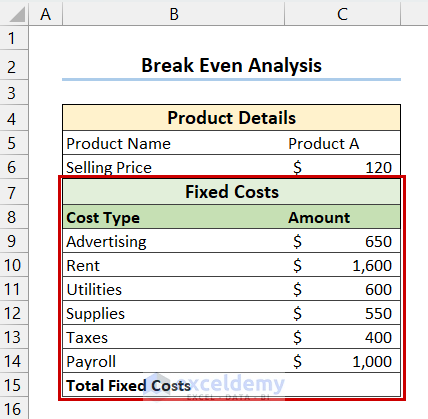
- Select the cell where you want the Total Fixed Costs and write the following formula:
=SUM(C9:C14)- Press Enter.
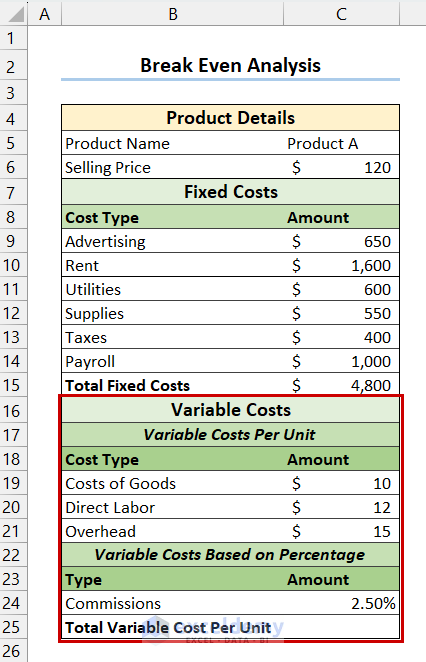
Step 3 – Find Total Variable Cost Per Unit
- Create a section for Variable Costs and fill that section with the necessary information.
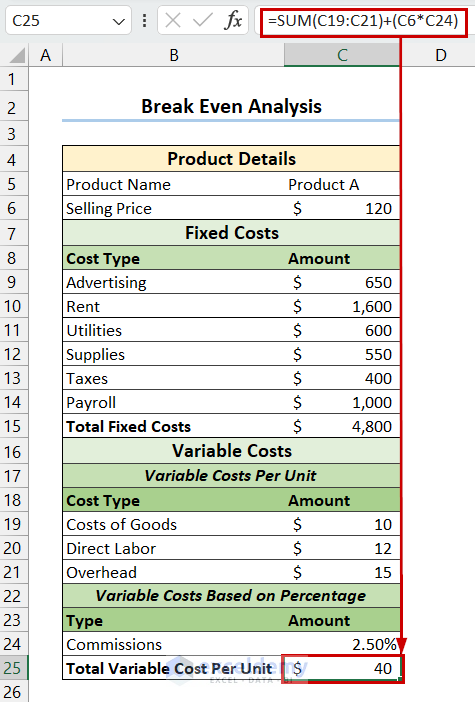
- Select the cell where you want the Total Variable Cost Per Unit and write the following formula:
=SUM(C19:C21)+(C6*C24)- Press Enter.
Step 4 – Create Break-Even Summary Section
- Create a section for Break-Even Summary.
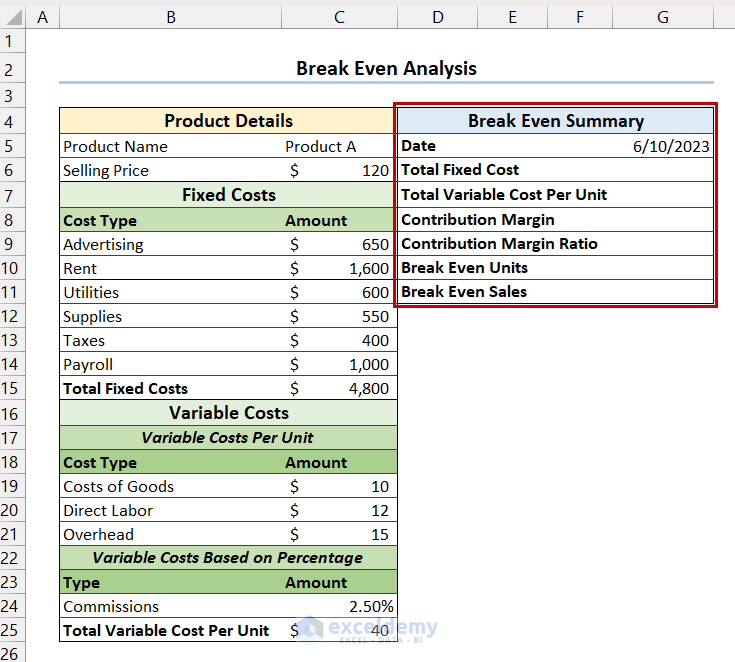
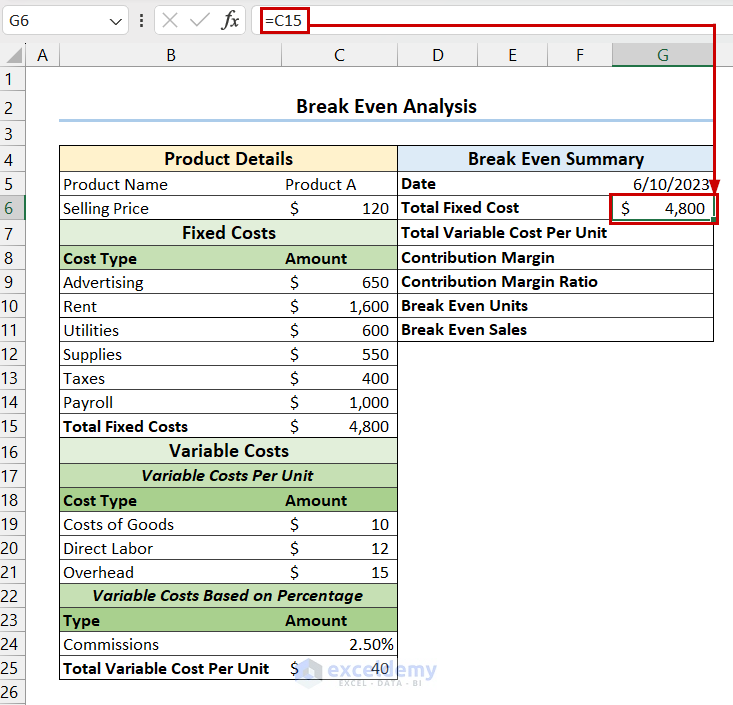
- Select the cell where you want the Total Fixed Cost and write the following formula:
=C15- Press Enter.
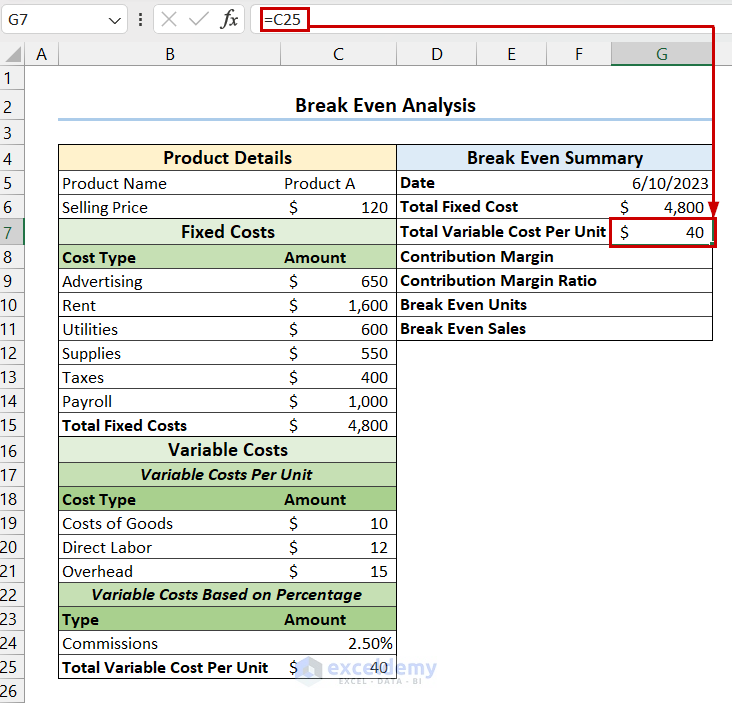
- Select the cell where you want the Total Variable Cost Per Unit and write the following formula:
=C25- Press Enter.
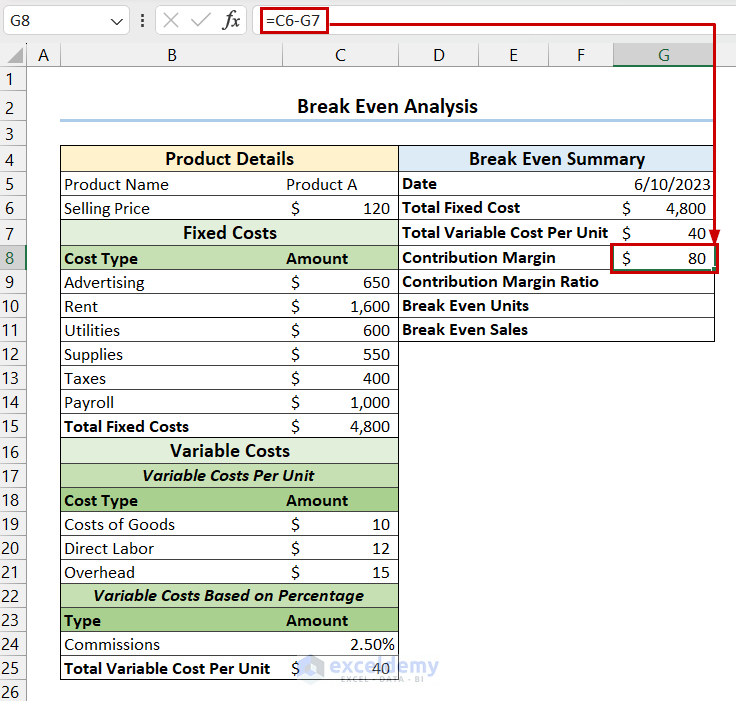
- Select the cell where you want the Contribution Margin and write the following formula:
=C6-G7- Press Enter.
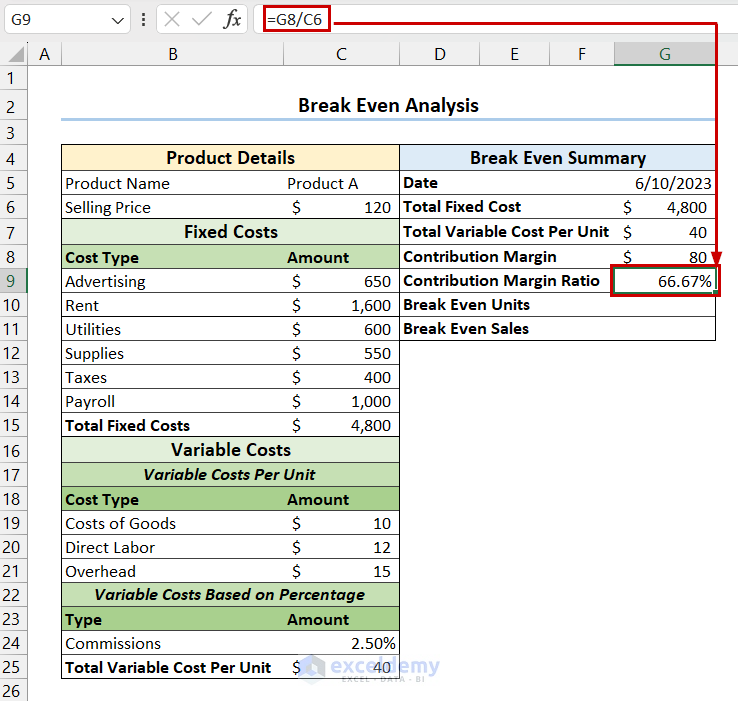
- Select the cell for the Contribution Margin Ratio and write the following formula:
=G8/C6- Press Enter.
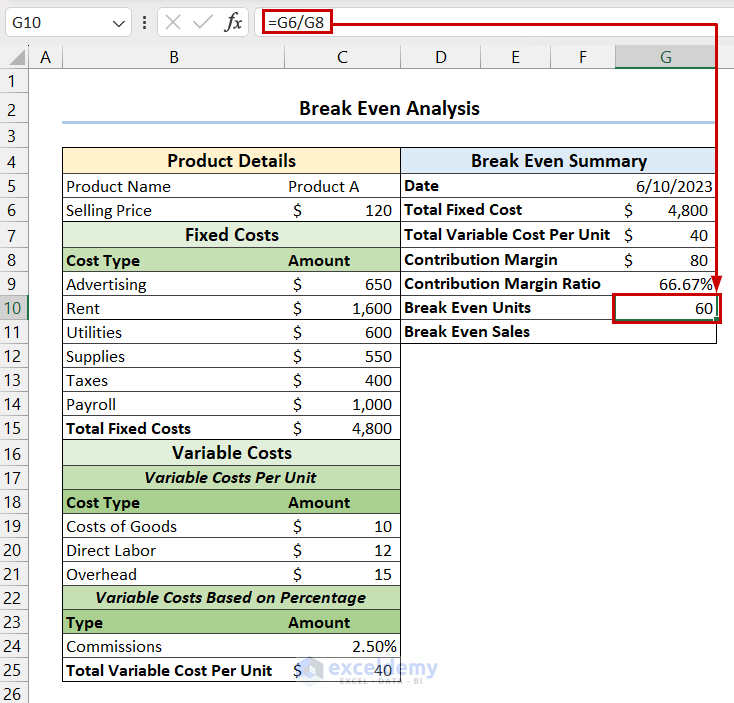
- Select the cell for the Break-Even Units and write the following formula:
=G6/G8- Press Enter.
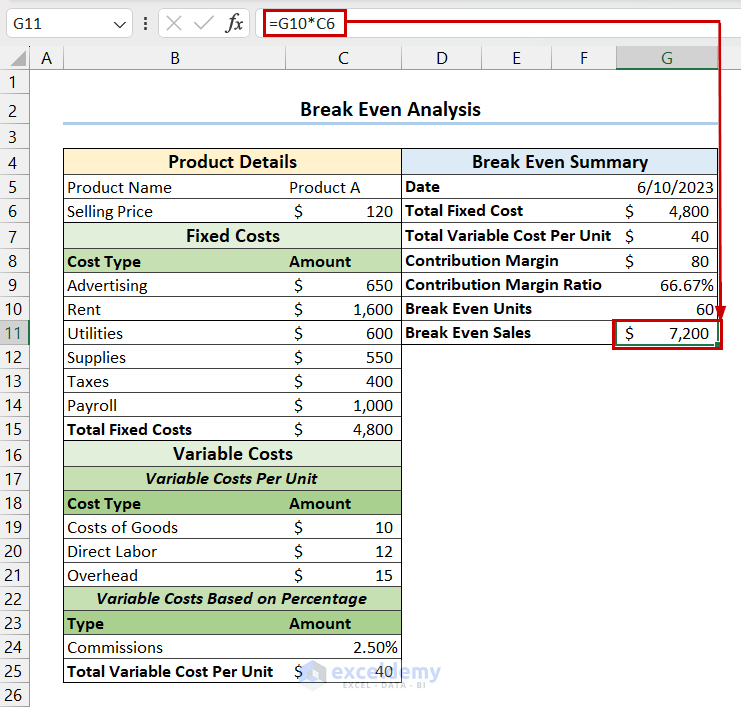
- Select the cell where you want the Break-Even Sales and write the following formula:
=G10*C6- Press Enter.
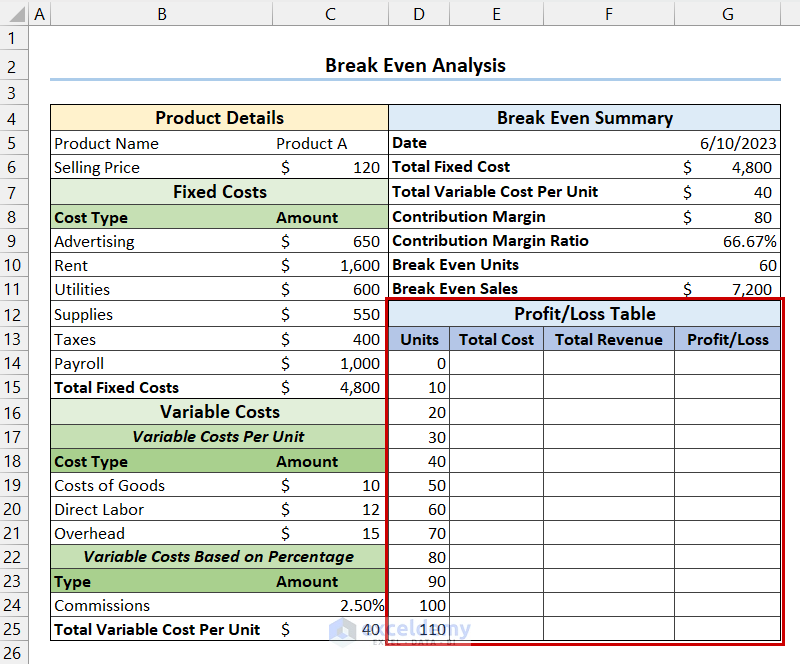
Step 5 – Create Profit/Loss Table
- Create a table for Profit/Loss.
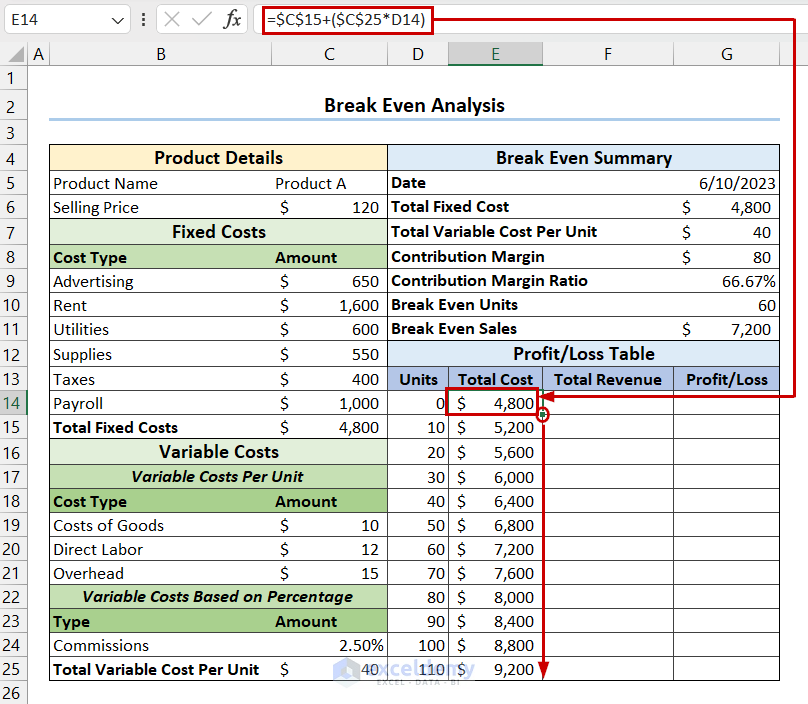
- For the Total Cost column, write the following formula in the first cell:
=$C$15+($C$25*D14)- Press Enter and drag the Fill Handle to copy the formula through the column.
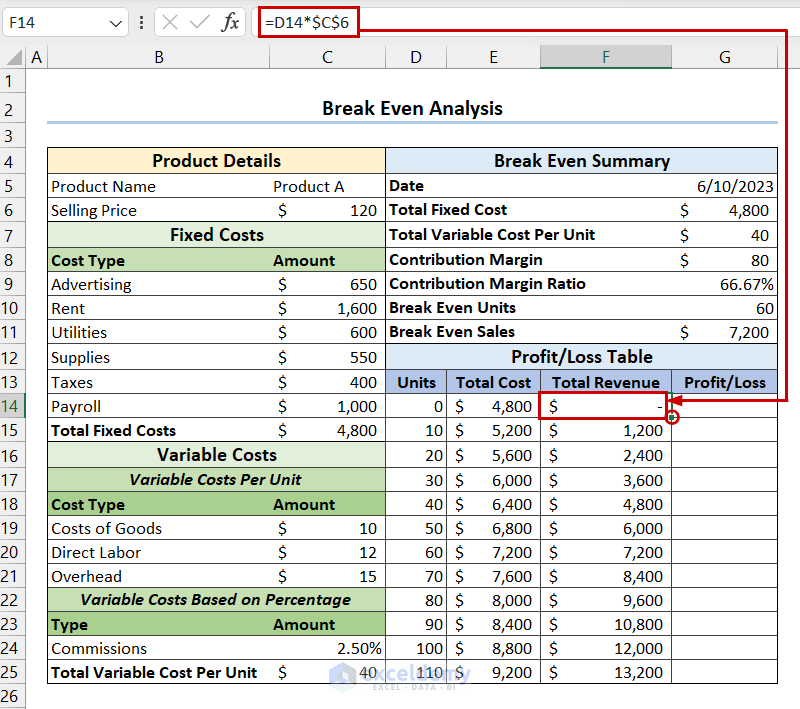
- Select first cell in the Total Revenue column and write the following formula.
=D14*$C$6- Press Enter and drag the Fill Handle down to copy the formula.
- Select the cell where you want the Profit/Loss and write the following formula:
=F14-E14- Press Enter and drag the Fill Handle to copy the formula.
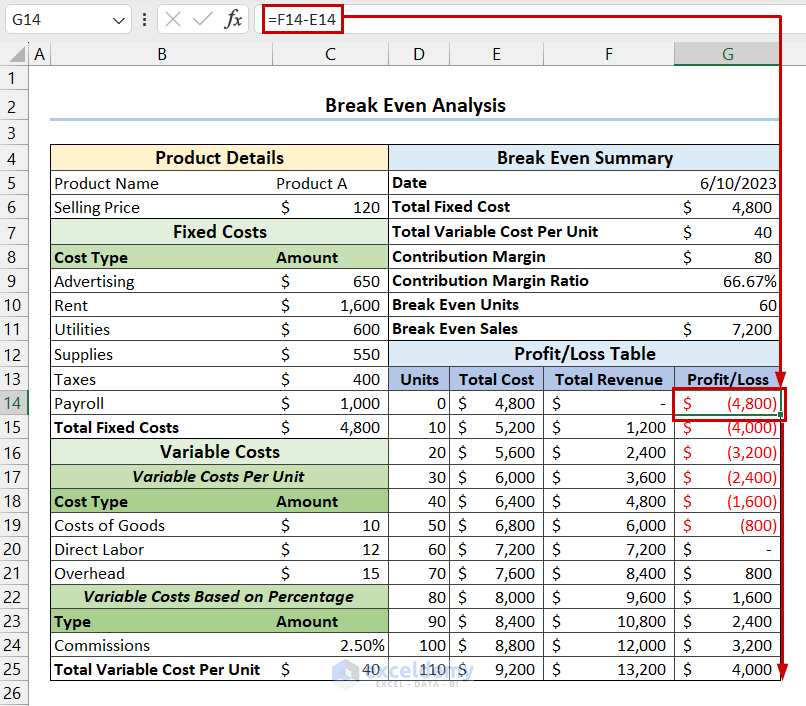
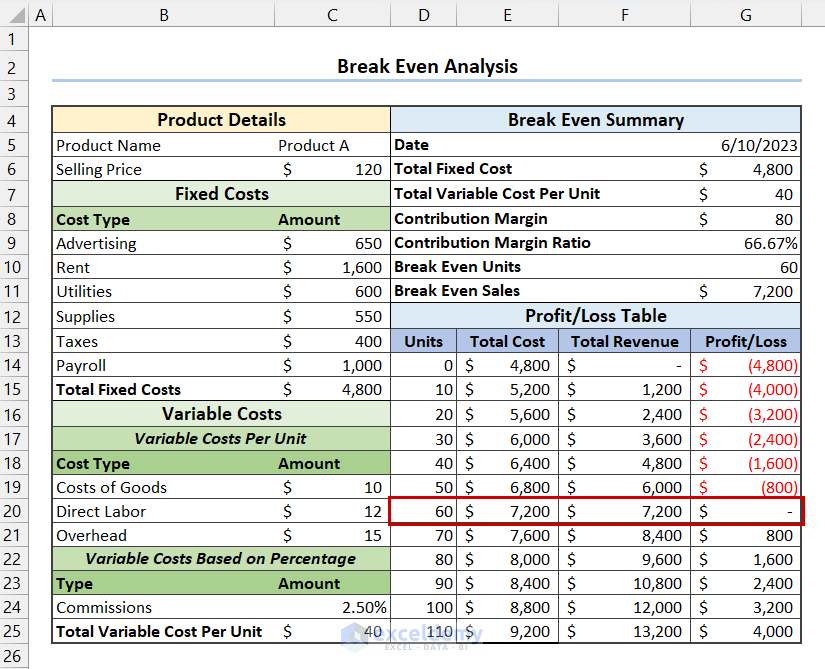
Step 6 – Final Output
- In the following image, you can see the final break-even analysis template.
Things to Remember
- You must include all kinds of costs in the break-even analysis.
- At the break-even point, there is no profit or loss.
Break Even Analysis in Excel: Knowledge Hub
- How to Calculate Break Even Point in Excel
- How to Do Multi Product Break Even Analysis in Excel
- How to Do Break Even Analysis with Goal Seek in Excel
- How to Make a Break-Even Chart in Excel
<< Go Back To Excel For Finance | Learn Excel
Get FREE Advanced Excel Exercises with Solutions!
