Method 1 – Applying FORECAST Function in Excel
The FORECAST function calculates or predicts the future value based on a given value. Calculating the existing value, this function makes a trend and predicts the future value.
Steps:
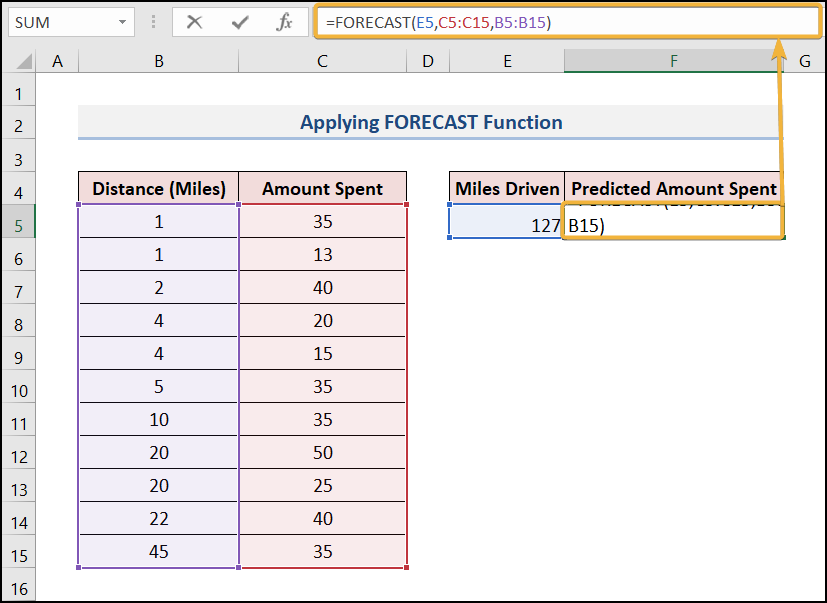
- Select cell F5 and enter the following
E5=The driven mile value for which we want to predict the amount.
The syntax FORECAST(E5, C5:C15, B5:B15) calculates the future value for the input value with a linear progression and predicts a value for the inserted value.
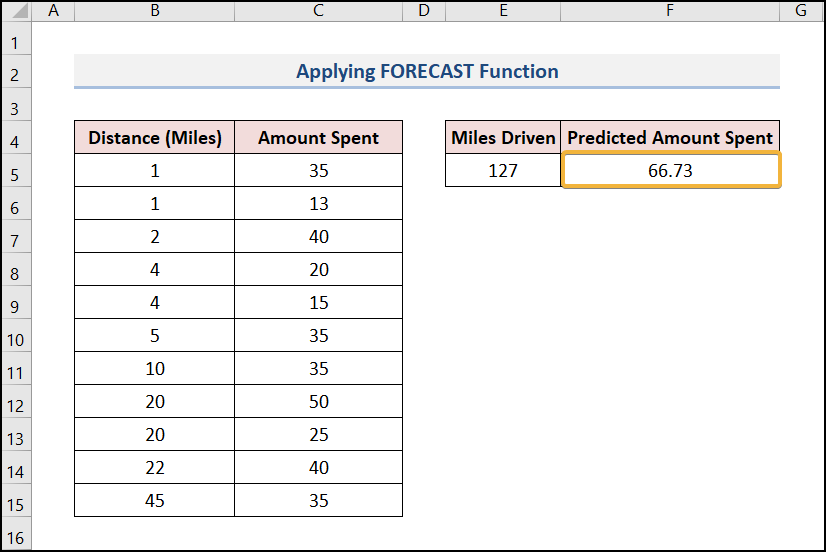
- Press ENTER.
- It will show you the predicted amount of the distance entered.
Method 2 – Using TREND Function for Forecasting in Excel
The TREND function calculates the values of a given set of X and Y and returns additional Y-values by using the least square method based on a new set of X-values along with a linear trend line.
Steps:
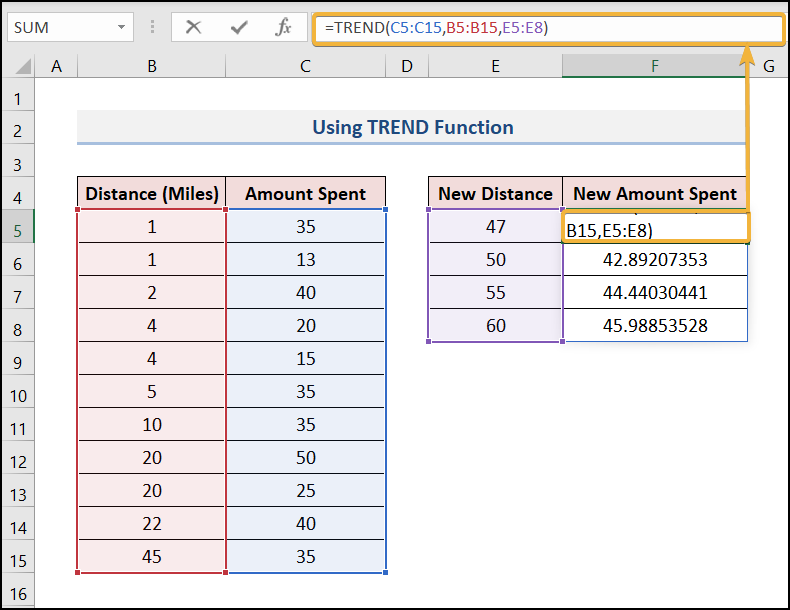
- Select cell F5 and enter the following formula,
The syntax TREND(C5:C15, B5:B15, E5:E8) mainly reads the data of C5 to C15 and B5 to B15 and finds out the relation. For the new set of values in E5 to E15, it predicts the new amount spent.
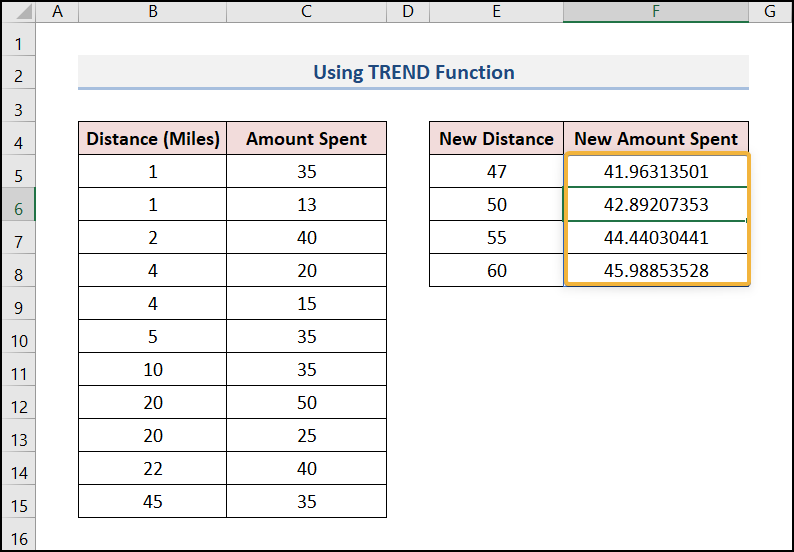
- Press ENTER.
- It will show you the new amount spent for the values entered.
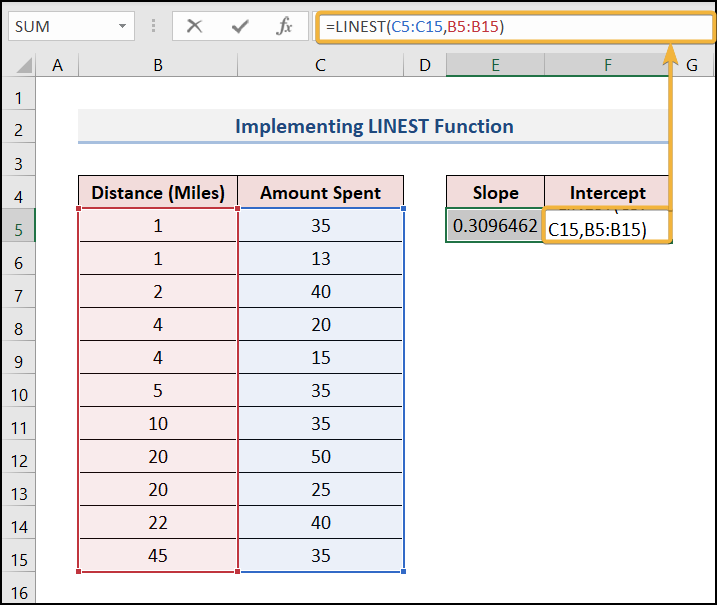
Method 3 – Implementing LINEST Function for Forecasting in Excel
The LINEST function is a statistical function that delivers a linear regression for dependent values with respect to some independent values. This function introduces a line with a regression equation. The simple linear equation for the line is:
y = mx + b (for single range of x)
Steps:
- Select the cells E5 and F5 and enter the formula.
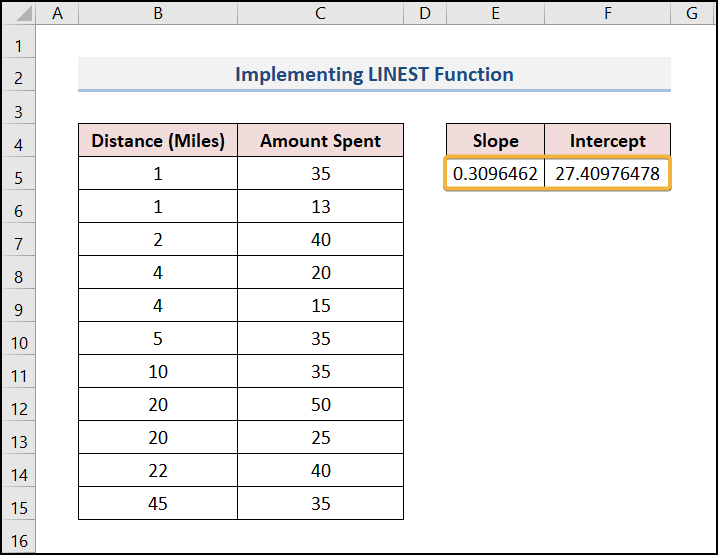
You have to select the entire value of C5 to C15 and B5 to B15. LINEST will use the least squares procedure and show the slop and Y-axis intercept.
- The result will look as shown in the image below.
Method 4 – Forecasting in Excel Using Fill Handle Tool
Steps:
- Select the sales data for the years 2005 to 2007.
- The Fill handle will appear at the bottom right corner of the selection.
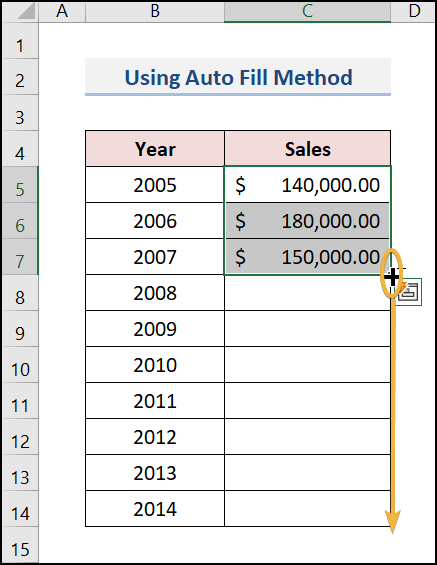
- Place your mouse pointer over the square box and you see the mouse pointer turn into plus sign. Click and hold your mouse pointer and drag it down.
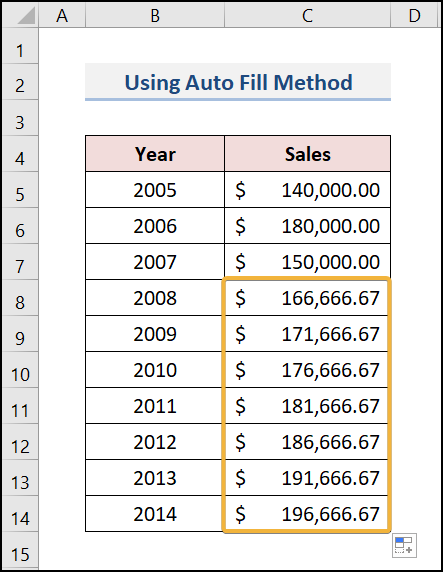
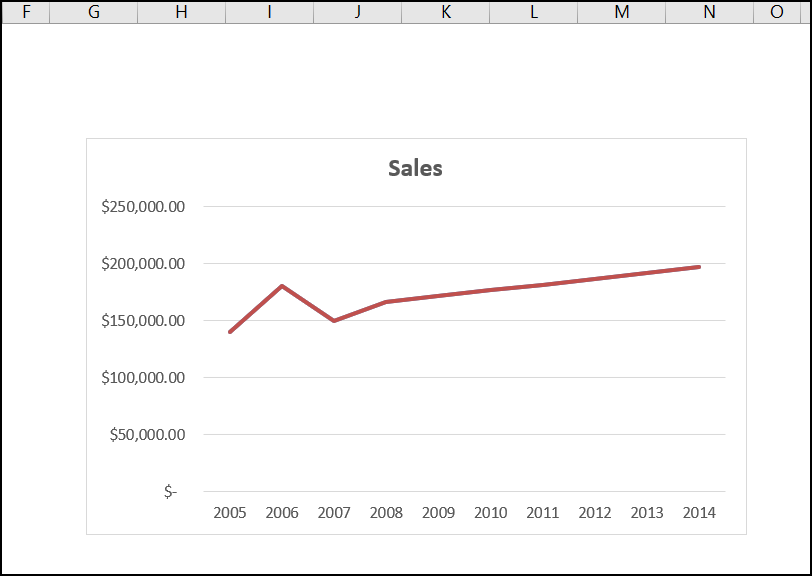
- The sales data has an upward trend. I create an XY chart using this data, you see from the chart that the data is in the uptrend. Though there are some trend breakouts in some places; the overall trend is up.
Download Practice Workbook
Get FREE Advanced Excel Exercises with Solutions!
