Break-even point analysis is a very important tool for any sort of business. Here, I will show you how to calculate break-even points in Excel with 3 effective methods.
What Is Break Even Point?
The break-even point is the calculation of product units to be sold for a specific unit price or calculating the selling price for a specific unit of product in order to make no profit or loss. The main purpose of this analysis is to find the marginal condition of any business. For calculating the break-even point we need:
- Fixed costs
- Variable costs
- Selling price per unit
- Revenue
The condition for the break-even point is:
Revenue = Total Fixed Costs (TFC) + Total Variable Costs (TVC)
In this section, I will show 3 effective methods to calculate the break-even point in Excel. I will use different features of Excel to calculate the break-even price. You can also calculate break-even price and break-even total sales in a similar manner.
1. Using Goal-Seek Feature to Calculate Break-Even Point
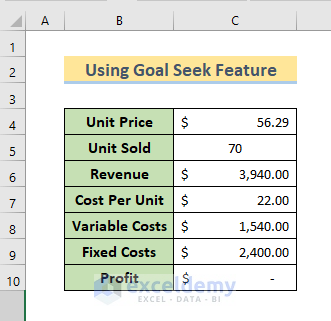
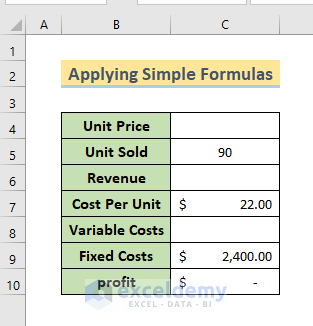
In the first method, I will show how to use the Goal-Seek feature to calculate the break-even point in Excel. I have used a dataset containing Unit Price, Unit Sold, Revenue, Cost Per Unit, Variable Costs, Fixed Costs, and Profit. Let’s follow the stepwise procedures.
- Primarily, fill up some data like in the image below. You can change the data according to your wish.

- Then, calculate Revenue by using the following formula in Cell C6.
=C4*C5
- Afterward, insert the following formula in Cell C8 to get the Variable Costs.
=C5*C7
- Now, calculate the Profit using the formula given below.
=C6-C8-C9
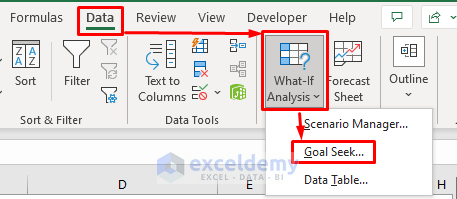
- Then, go to the Data tab and select What-If Analysis > Goal Seek.
- In the appeared Goal Seek window, give the cell reference for Profit ($C$10) in the Set cell section, again set To Value as 0, also set By changing cell with Unit Price cell ($C$4).
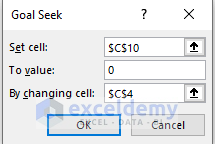
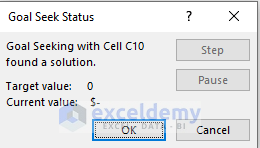
- Further, press OK, and in the next window you will see the solution.
- Again, press OK.
- Finally, we will see the updated Unit Price as the result of the break-even point.
Read More: How to Do Break-Even Analysis with Goal Seek in Excel
2. Determining Break Point by Applying Simple Formulas
If you are interested in how to calculate break-even points in Excel using formulas, this method is suitable for you. For demonstration, I have used the same dataset as Method 1. Follow the stepwise procedures given below for this method.
- First, fill up some data as in the image below.
- Then, write the following formula in Cell C8 to calculate the Variable Costs.
=C5*C7
- Afterward, write the following formula in Cell C4 to calculate the Unit Price.

- In addition, you can calculate the Revenue in Cell C6 using the formula given below.
=C4*C5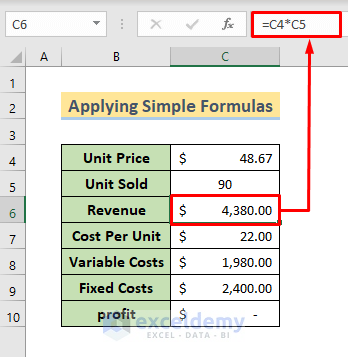
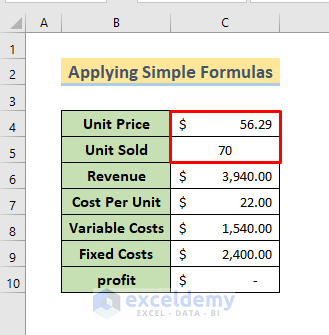
- Finally, change the Unit Sold and you will see the adjusted Unit Price for the break-even point.
Read More: How to Calculate Break-Even Sales with Formula in Excel
3. Utilizing Excel Chart to Calculate Break-even Point
We can also use the Chart command to determine the break-even point in Excel. Let’s follow the stepwise procedures given below.
- First, create a dataset like in the image below. You can change the data according to your need.
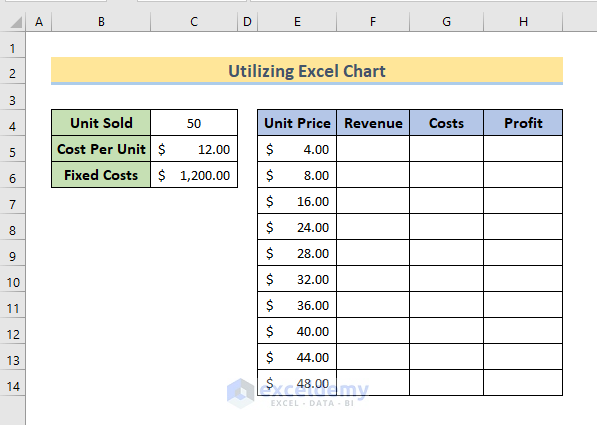
- Secondly, calculate the Revenue in Cell F5 using the following formula.
=E5*$C$4
- Then, write the following formula in Cell G5 to find the Costs.
=$C$4*$C$5+$C$6
- Further, use the following formula in Cell H5 to get the Profit.
=F5-G5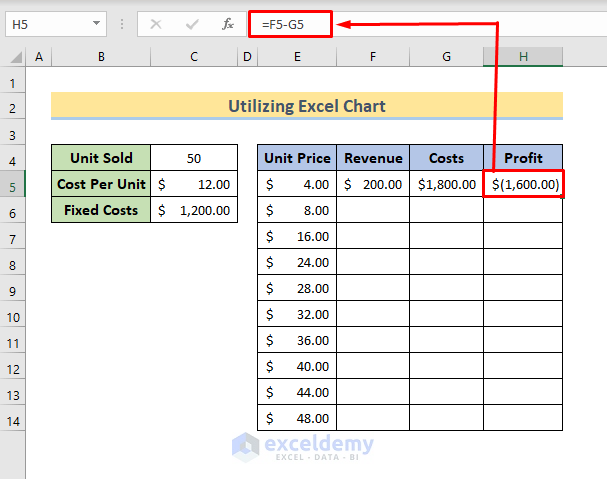
- Afterward, use the Fill Handle to copy the formulas in the whole table for different Unit Prices.
- Next, select the table.

- Now, go to the Insert tab and select Insert Line or Area Graph > Line.

- Simultaneously, we will see a line chart like below.

- Select the chart and right–click to select Select Data.

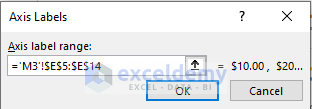
- After that, in the Select Data Source window select Unit Price and click on Edit in the Horizontal (Category) Axis Labels.

- In the axis Labels window, select the whole column Unit Price. Press OK.
- Finally, we will see Profit is 0 for 50 as Unit Sold in the table. Also, in the line chart, we will see the Revenue line and Cost line meet when the Unit sold is 50.

Download Practice Workbook
You can download the practice workbook from here.
Conclusion
Break-even point calculation helps a lot for business analysis and development. In this article, I have shown you how to calculate break-even points in Excel in 3 simple ways. If you have any queries or suggestions, let us know by commenting. Visit our ExcelDemy Website for similar articles regarding Excel.
Related Articles
- How to Do Multi-Product Break-Even Analysis in Excel
- How to Do NPV Break-Even Analysis in Excel
- How to Make a Break-Even Chart in Excel
- How to Calculate Break-Even Analysis with Formula in Excel
<< Go Back To Break Even Analysis Excel | Excel For Finance | Learn Excel
Get FREE Advanced Excel Exercises with Solutions!
