If you run a business or work for a company, knowing the profit margin is important. For this, you need to conduct break-even analysis. In this article, we will show you how you can calculate the break-even sales formula in Excel.
What Is Break Even Sales?
The break-even sale is the level of production at which the costs of production equal the revenues for a product.
This term is used for production analysis. This is the minimum production that is required to avoid any loss.
How to Calculate Break Even Sales with Formula in Excel: 2 Ways
We can use the Goal Seek feature of Excel to conduct this break-even analysis. Also, we can perform this analysis with Chart. So let’s elaborate on these 2 procedures one by one here.
1. Use Goal Seek Feature to Calculate Break-Even Sales in Excel
Goal Seek is an in-built Excel feature. This feature is particularly used for data analysis. We can set criteria and on the basis of this criteria the feature will give output.
Step 1:
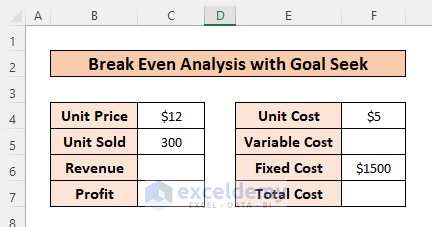
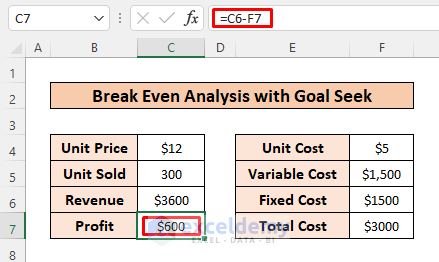
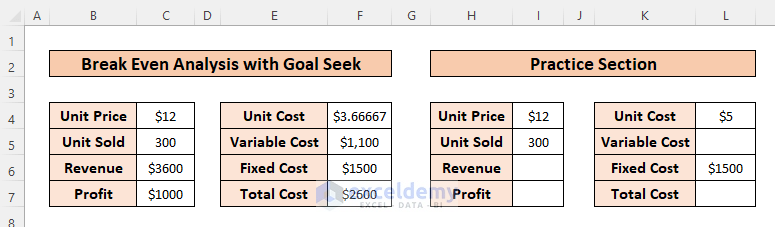
We have created a dataset containing values for Unit Price, Unit Sold, Unit Cost and Fixed Cost. Now we have to find values for other cells as well.
Step2:
We have to find the values for Revenue, Variable Cost, Total Cost and Profit.
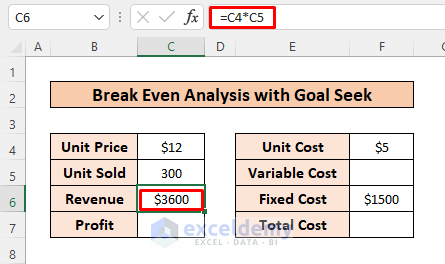
If we multiply unit price with unit sold, we get the revenue value.
➤ So, write the following formula in C6 and press ENTER.
=C4*C5Here,
- C4 = Unit Price
- C5 = Unit sold
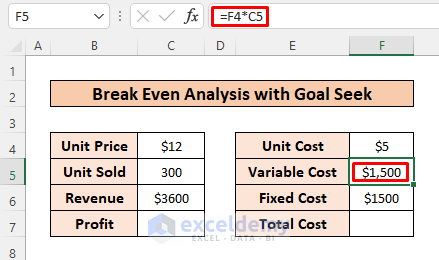
Variable cost depends on unit cost and number of sold units.
➤ So, write the following formula in F5 and press ENTER.
=F4*C5Here,
- F4 = Unit Cost
- C5 = Unit Sold
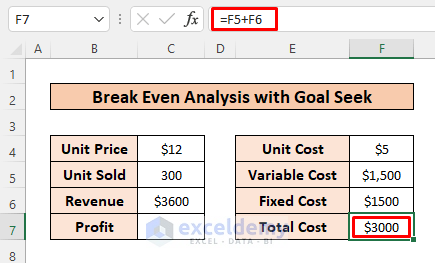
➤ Now, find the total cost.
It’s simply the summation of variable cost and fixed cost.
=F5+F6Here,
- F5 = Variable Cost
- F6 = Fixed Cost
➤ And, finally, the profit will be the difference between Revenue and Total Cost.
=C6-F7Here,
- C6 = Revenue
- F7 = Total Cost
So, we have got all the values for applying the Goal Seek feature.
Step 3:
Now, we will analyse this dataset.
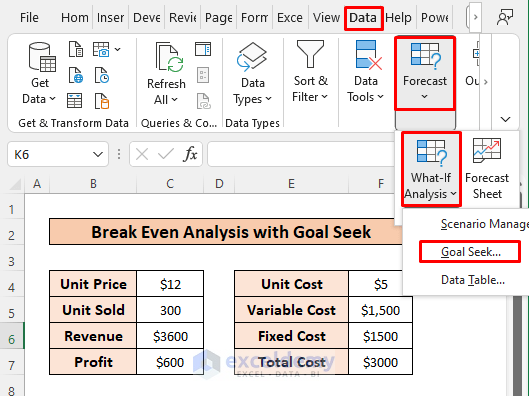
➤ Go to Data > Forecast > What-If Analysis.
➤ Then, select Goal Seek from the drop-down options.
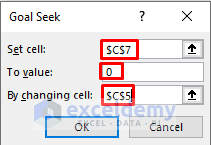
Doing so, the Goal Seek window will open.
In this window, there are three boxes.
➤ Write the following in these boxes and Press OK.
- Set Cell: $C$7 (the cell you want to fixate)
- To value: 0 (the value you want)
- By changing cell: $C$5 (the cell you want to change)
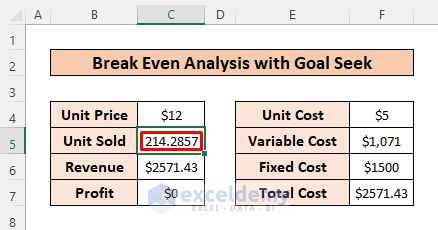
This will mean that, under these given conditions, how many units have to be sold so that the total cost remains per with the revenue.
➤ Thus, the result shows that the company has to sell approximately 214 units so that it doesn’t incur any losses.
Step 4:
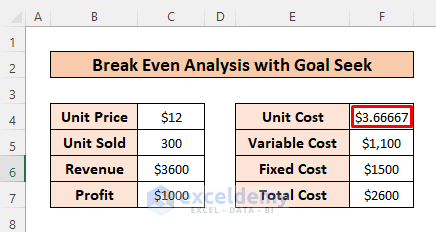
Now, let’s try other criteria. We want to find out the revised Unit Cost for which the company will have a Profit of $1000.
➤ So as shown previously, write the following in these three boxes and press OK.
- Set Cell: $C$7 (the cell you want to fixate)
- To value: 1000 (the value you want)
- By changing cell: $F$4 (the cell you want to change)
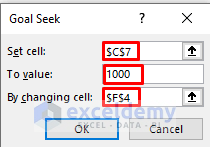
➤ Thereby, we get the result which tells us that if the company has to incur a profit of $1000 the Unit Cost has to be $3.67.
You can set other criteria and see the result for yourself.
Read More: How to Do Multi-Product Break-Even Analysis in Excel
2. Calculate Break Even Sales Formula in Excel with Chart
We will calculate all possible scenarios manually and then insert the result in the chart. The chart will then show us the break even sales.
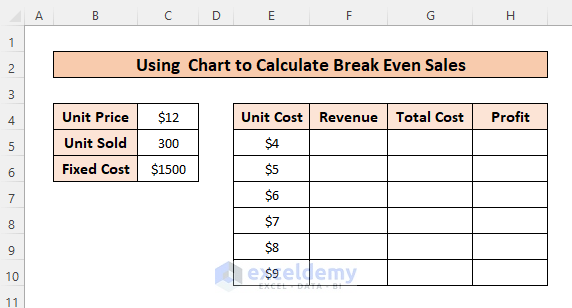
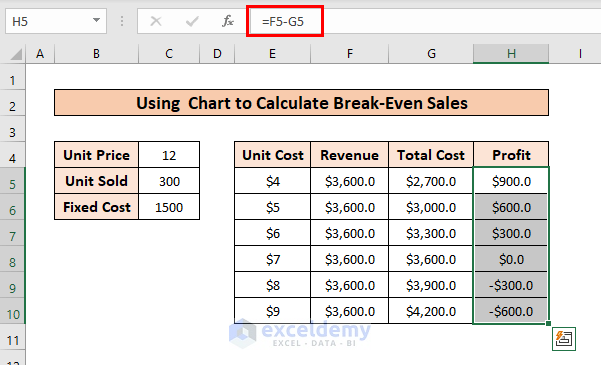
We have taken a dataset. The Unit price, Unit Sold and Fixed Cost are constant. We will find Revenue, Total Cost and Profit for different Unit Cost values and find the break even sales in the chart.
Step 1:
➤ The formula for Revenue, Total cost and Profit are
Revenue= Unit Price*Unit Sold
Total Cost= Fixed Cost+Unit Cost*Unit Sold
Profit= Revenue-Total Cost
Using these formulas, we calculated all the values.
Just apply the formula below in cell F5 for finding Revenue and drag the formula down.
=$C$5*$C$4Here,
- C5 = Unit Sold
- C4 = Unit Price

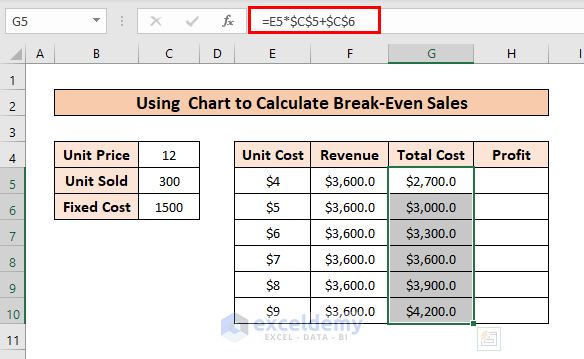
And for finding Total Cost, the formula will be
=E5*$C$5+$C$6Here,
- E5 = Unit Cost
- C5 = Unit Sold
- C6 = Fixed Cost
Similarly, formula for Profit will be
=F5-G5Here,
- F5 = Revenue
- G5 = Total Cost
Step 2:
Now, we have to put these column values in the chart.
➤ First, select these three columns.
➤ Then, click on the Insert Line option from the Insert tab.
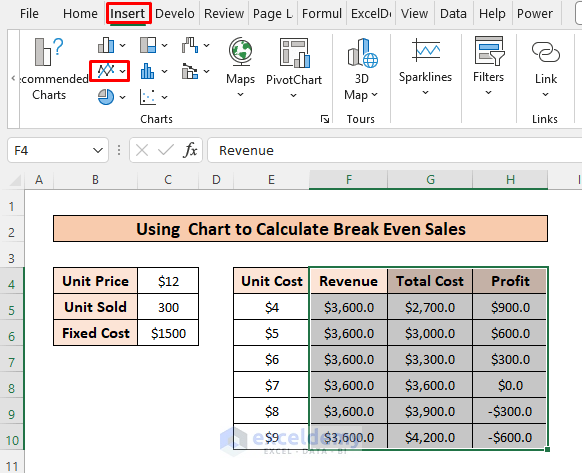
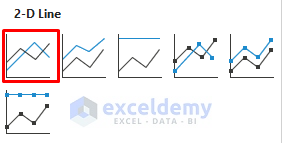
A window like this will open.
➤ Select any of these option.
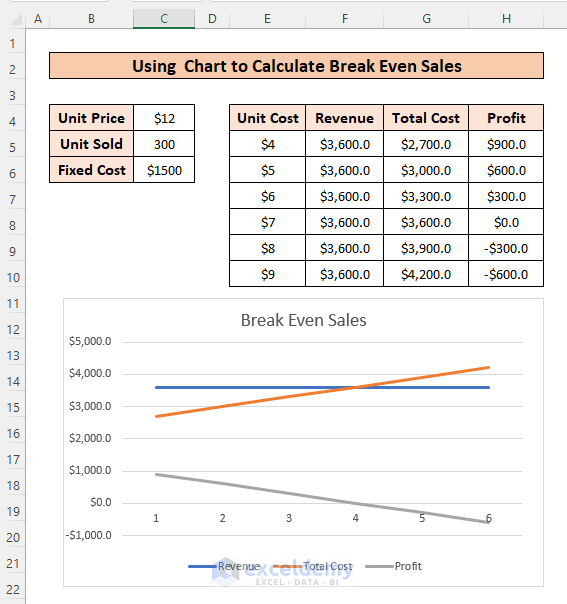
So, the chart shows three distinctive lines for Revenue, Total Cost, and Profit.
And we can clearly get an idea what is the break-even sales.
Read More: How to Make a Break-Even Chart in Excel
Practice Section
Here I am providing you a practice section so that you can practice yourself.
Download Practice Workbook
You can download this workbook from the link below.
Conclusion
Thank you for making it this far. We hope you find the content of this article useful. If there are any queries or suggestions, feel free to leave them in the comment section.
Related Articles
- Mortgage Break-Even Analysis in Excel
- How to Calculate Break-Even Points in Excel
- How to Do NPV Break-Even Analysis in Excel
<< Go Back To Break Even Analysis Excel | Excel For Finance | Learn Excel
Get FREE Advanced Excel Exercises with Solutions!
