If you are searching for the solution or some special tricks to make a table in Excel with lines then you have landed in the right place. There are some quick steps to make a table in Excel with lines. This article will show you each and every step with proper illustrations so you can easily apply them for your purpose. Let’s get into the central part of the article.
What Is an Excel Table?
In the later versions of Excel 2004, the Table feature is available to convert a simple dataset to a formatted table. An Excel table allows the user to do many things like sorting, filtering, showing totals, etc easily which is not possible directly in a simple dataset.
Benefits of Excel Table:
- Sorting Data: You can easily sort data by clicking on the drop-down arrow in the column header.
- Filtering Data: You can also filter data as your wish from the options that are opened by clicking the drop-down arrow in the header.
- Inserting: You can easily insert a new row or column into the table and the table will expand or shrink its range automatically.
- Styles: You can select any of the built-in styles to format the table or you can create custom styles for the table.
- Autofill: When you apply any formula or format to any cell of a column in the table then it will be auto-filled in other cells of the column.
- Table Name: When you have multiple datasets then you can refer to any cell with the name of the table and column header.
- Total of Rows: You can also show the subtotal of the rows in a column without using any formula.
Steps to Make a Table in Excel with Lines
In this section, I will show you how to make a table in Excel with lines on Windows operating system. You will find detailed explanations of methods and formulas here. I have used Microsoft 365 version here. But you can use any other versions as of your availability. If face any issues in your version then leave us a comment.
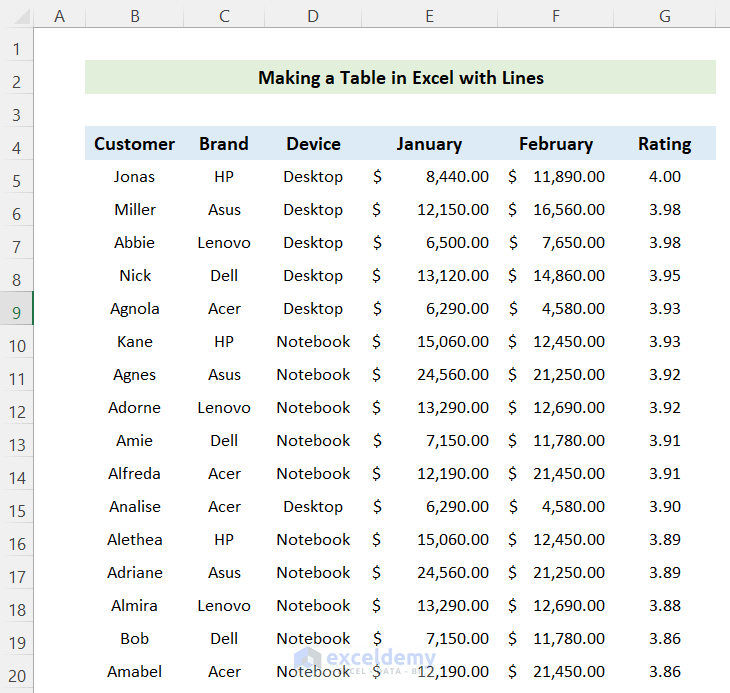
📌 Step 1: Prepare Dataset
First, you have to prepare the dataset before creating a table. For this, create a header row then insert the values accordingly.
📌 Step 2: Format the Dataset as a Table
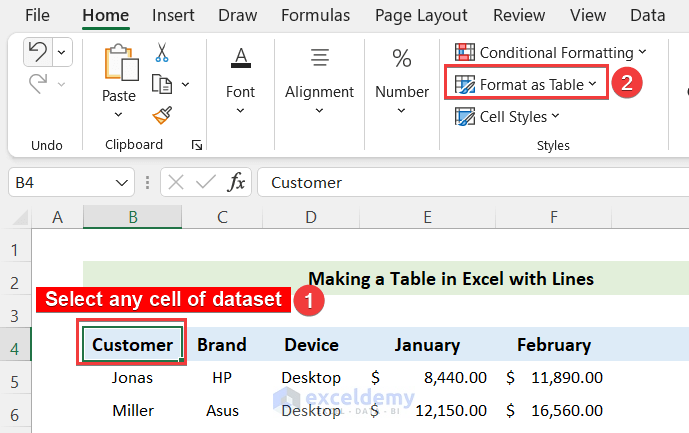
After inserting the data into a worksheet, select any cells of the dataset. Then, go to the home tab and click on the “Format as Table” option in the “Styles” menu.
Read More: Create Table in Excel Using Shortcut
📌 Step 3: Apply a Table Style
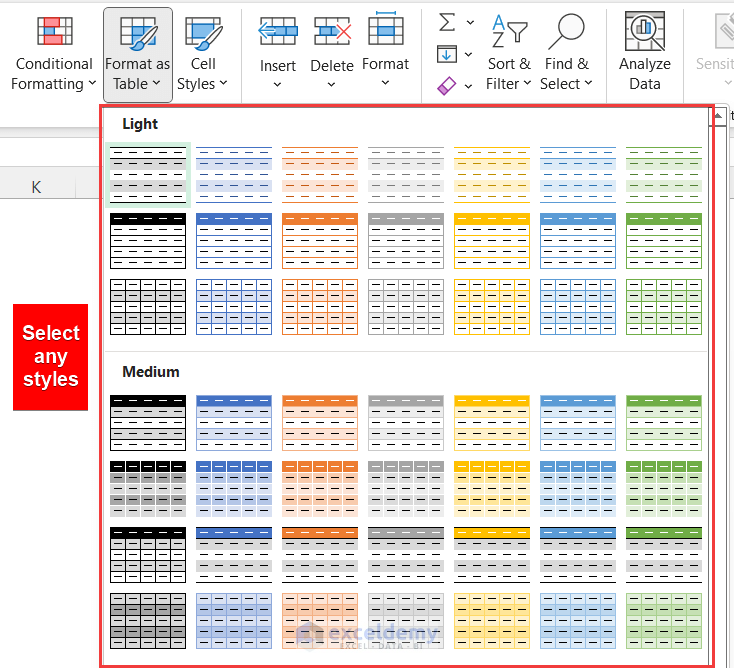
When you click on the “Format as Table” option then a list of table styles will appear. Select any of the styles from the options and apply on the dataset.
📌 Step 4: Select Data Range for Table
After selecting the Table Style a pop-up window will appear which will show the range of the dataset to make a table. Recheck the data range whether it is correct or not. As you have selected a cell on the dataset so, Excel will select all the cells adjacent to the selected one automatically.
- Tick that the checkbox says “My table has headers” if not ticked.
- Then, press OK.

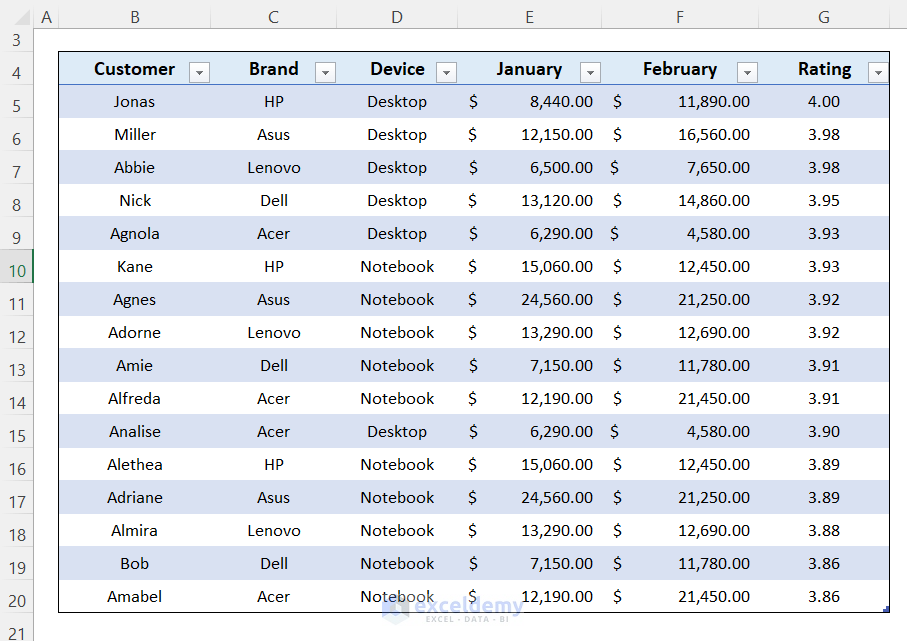
As a result, you will see the dataset converted to an Excel table. And, you will find there is a drop-down arrow in each cell of the header row. But you should notice that there is no borderline in the table.
Read More: How to Create a Table with Subcategories in Excel
📌 Step 5: Create Border Lines in the Table
Excel table styles contain different colors for rows to differ them from each other but there is no borderline in them. So, when you will move to print you will see no separation line between the rows and columns. For this, you have to imply the border line manually. Follow the steps below to do this:
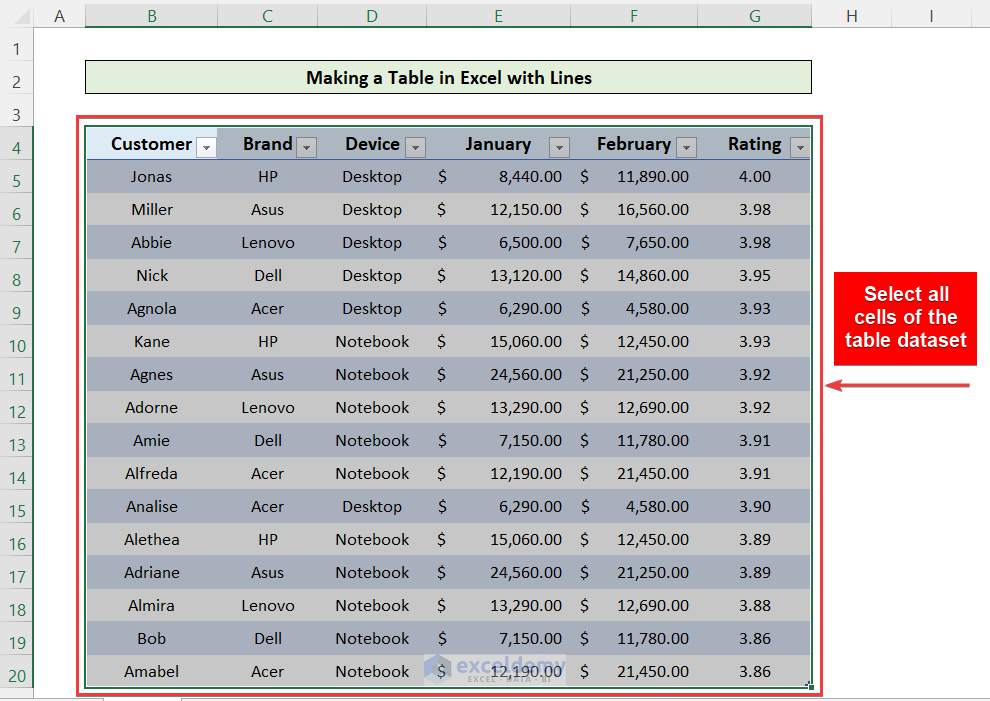
- Select all the cells of the table first.
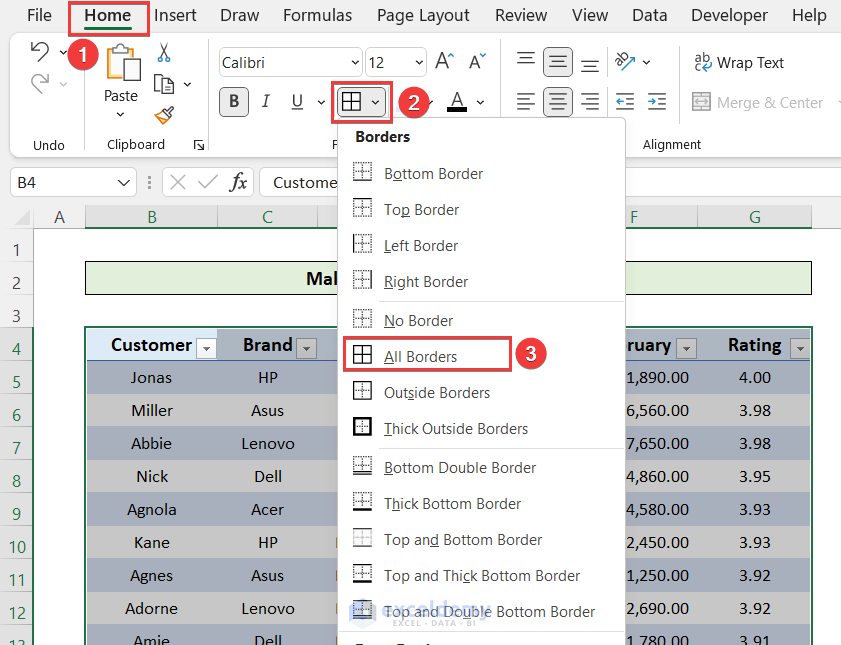
- Then, go to the Home tab and click on the Border icon in the Font menu.
- A list of borders will appear and select the “All Borders” option.
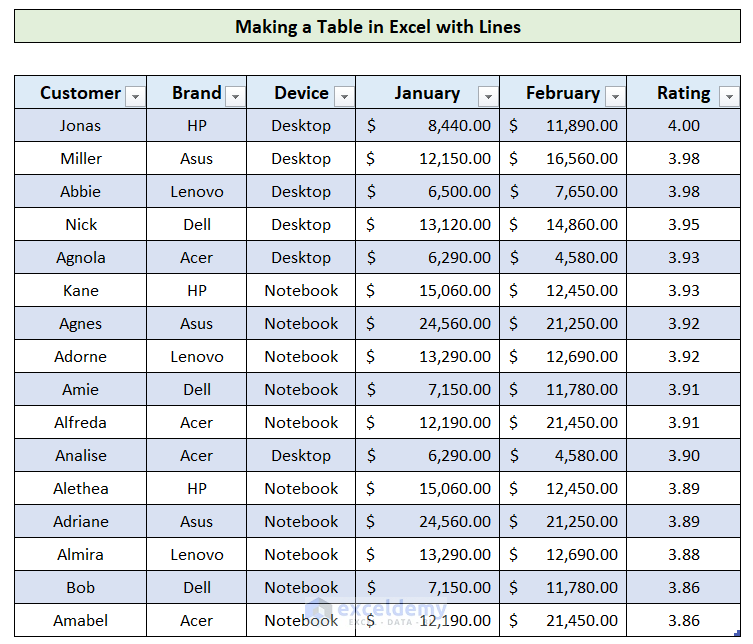
As a result, you will see that the table rows and columns are separated by lines. Now, if you want to print then you will see lines between the rows and columns.
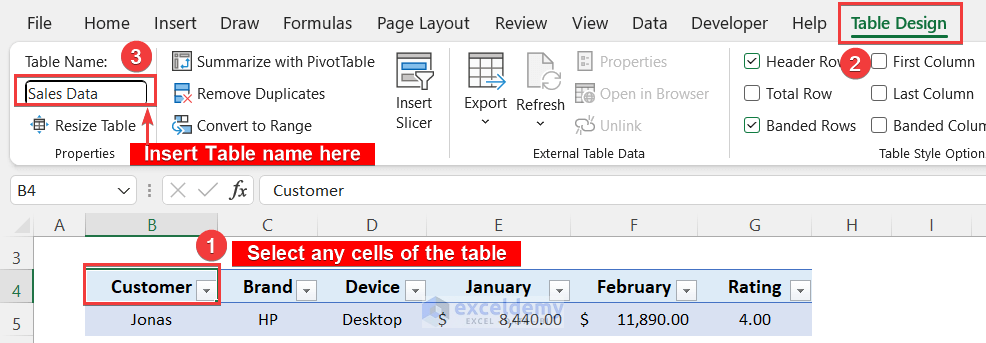
In addition, you can apply a name to the table for identification, For this:
- Select any cell of the table and go to the Table Design tab in the top ribbon.
- Then, in the Properties menu, you will find a box to insert a table name. Write an appropriate name in the box.
- So, you can refer or call this table by this name.
Read More: How to Create a Table in Excel with Multiple Columns
Download Practice Workbook
You can download the practice workbook from here:
Conclusion
In this article, you have found how to make a table in Excel with lines. I hope you found this article helpful. Please, drop comments, suggestions, or queries if you have any in the comment section below.
Related Articles
- Create a Table in Excel Based on Cell Value
- How to Create a Table with Existing Data in Excel
- How to Create a Table Without Data in Excel
- How to Create a Table with Merged Cells in Excel
- How to Add New Row Automatically in an Excel Table
<< Go Back to Make a Table | Excel Table | Learn Excel
Get FREE Advanced Excel Exercises with Solutions!
