In this tutorial, I am going to show you 3 effective ways to create an Excel table with row and column headers. Headers help to make tables more readable. They are also the means to apply any sorting and filtering to the dataset. Although there are quite a few methods to add headers to table, they all have slightly distinct functions.
How to Create Excel Table with Row and Column Headers: 3 Ways
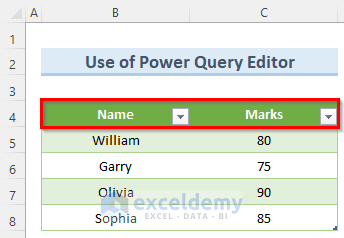
1. Create Table in Excel with Column Headers
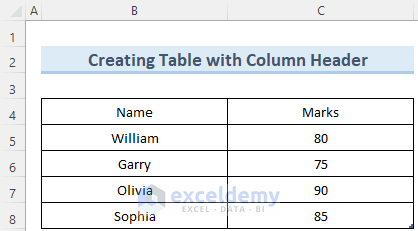
For this method, we will use a dataset of the marks of four students. Using the dataset we will create an Excel table with row and column headers. Note that the data that you want to set as the table header, should be on row 4. Let us go through the steps to create an Excel table with row and column headers in this dataset.
Steps:
- First, drag and select the whole dataset.
- Likewise, you can click on cell B4 and press Ctrl+Shift+Down Arrow then Ctrl+Shift+Up Arrow as a shortcut.
- After selecting the dataset, you should see the Quick Analysis option on the lower right.
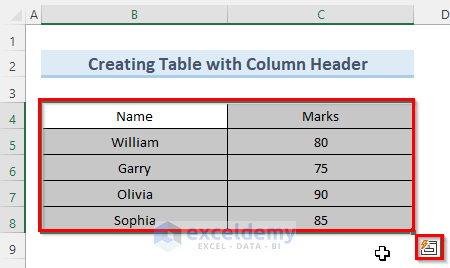
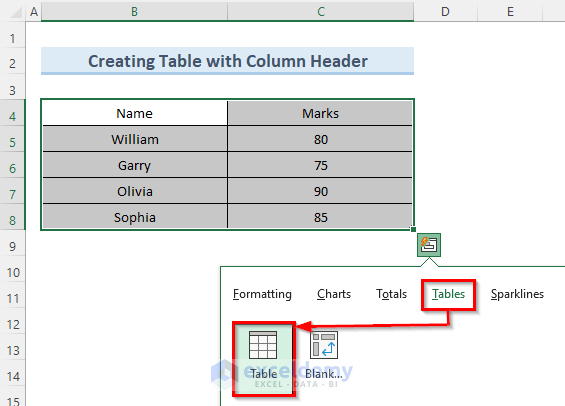
- Here, click on this option and go to the Tables tab.
- Next, click on the option Table.
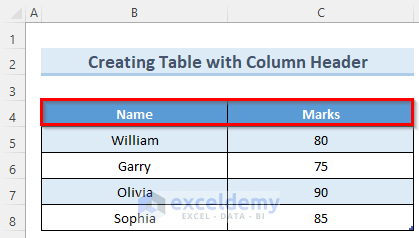
- Finally, Excel will create a table from the dataset and more importantly add a header as well.
Read More: How to Create Column Headers in Excel
2. Insert Excel Table with Column Headers Using Power Query Editor
The Power Query Editor in Excel is really helpful to create an Excel table with row and column headers without making any changes to the source dataset. Follow the steps below to use this tool.
Steps:
- First of all, select the dataset as I showed previously.
- Then go to the Data tab.
- From the Get & Transform Data section click on From Table/Range.

- After that, a new window with the name Power Query Editor will open.
- Now, under the Home tab, click on Close & Load.
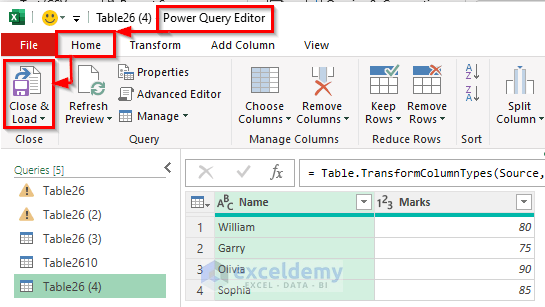
- Finally, the Power Query Editor will create a table of our dataset within a new worksheet and will insert column headers.
- Additionally, this will add filter options to allow the sort and filter of your data table.
Read More: How to Change Column Header Name in Excel VBA
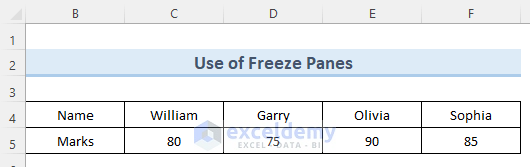
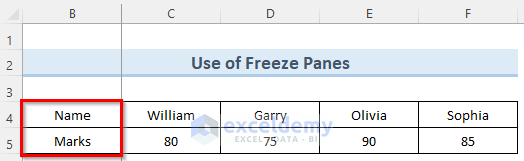
3. Add Row Headers in Excel Table by Freezing Panes
For this method, we will use the previous dataset. But this time the data is listed horizontally instead of vertically. Also, we want to make cells B4 and B5 our row headers.
Steps:
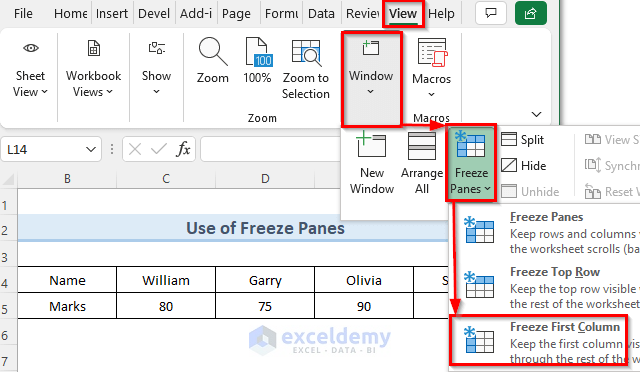
- To begin with, set the window in such a way that column B becomes the first visible column from the left.
- Second, navigate to the View tab.
- Then go to Window > Freeze Panes > Freeze First Column.
- As a result, the cells B4 and B5 will now become the row headers and will not move from the screen.
- Finally, to make the headers more visible, you can make them bold and change their fill color.

Read More: How to Change Column Headings in Excel
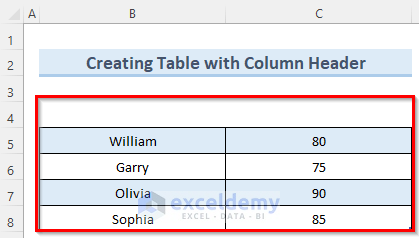
How to Hide or Show Row and Column Headers in Excel Table
In some cases, you might want to hide row and column headers in your Excel table to focus more on the dataset itself. You can do this very quickly by following the steps below.
Steps:
- To start with, go to the Table Design tab on top of the screen.
- Then, click on the Table Style Options dropdown.
- Here, simply uncheck the Header Row options.
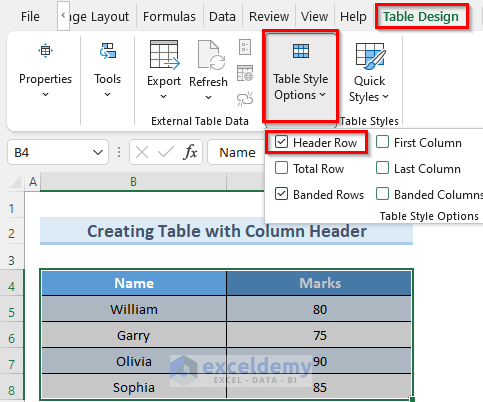
- As a result, Excel will hide the column headers.
- Besides, if you want to bring the headers back, just check the option Header Row.
Read More: How to Title a Column in Excel
Download Practice Workbook
You can download the practice workbook from here.
Conclusion
I hope that you found the 3 ways I showed in this tutorial useful. To better organize data and make the document easier to read, you can use these methods to create an Excel table with row and column headers. Also, if you have headers in your data tables, you can easily scan them for a header of your interest. If you have any queries, please let me know in the comments.
Related Articles
- How to Rename Column in Excel
- How to Remove Column Headers in Excel
- How to Change Excel Column Name from Number to Alphabet
- How to Repeat Column Headings on Each Page in Excel
- How to Remove Column1 and Column2 in Excel
- [Fixed] Excel Column Numbers Instead of Letters
<< Go Back to Rows and Columns Headings | Rows and Columns in Excel | Learn Excel
Get FREE Advanced Excel Exercises with Solutions!
