The article will show you the proper steps to calculate the Standard Error of Proportion by using Microsoft Excel. It’s an important parameter in the field of statistics. It helps us strongly predict an occurrence in a sample space.
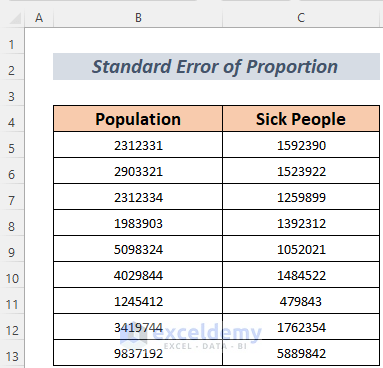
In the dataset, we have information about the number of population and sick people in different states. We are going to find out the Standard Error of Proportion for these sick people in different states.
What Is Standard Error of Proportion?
The Standard Error of Proportion refers to the change of a sample occurrence with respect to the total occurrence or population. Generally, the proportion between favorable events and sample space gives us the probability of an event occurring. But practically, it is still erroneous. Suppose, you toss a coin to a witcher 100 times and the formula of probability tells you that you should get heads and tails 50 times each. But it does not happen. The Standard Error of Proportion gives us a better idea about predicting an occurrence or situation based on the Sample rather than the entire Data.
The formula for calculating the Standard Error of Proportion (SEP)is given below.

Where, Proportion: P/n
p = Proportion of the Sample, in other words, the ratio between favorable outcomes and total incidents.
n = Number of total population or incidents.
Calculate Standard Error of Proportion in Excel: 2 Steps
We are going to calculate the Standard Error of Proportion for individual states first. Let’s go through the procedure below.
Step1: Calculate Proportion from Data
In the beginning, we need to calculate the sample proportion.
- First, make some necessary columns for Proportion and Standard Error of proportion.
- After that, type the following formula in cell D5.
=C5/B5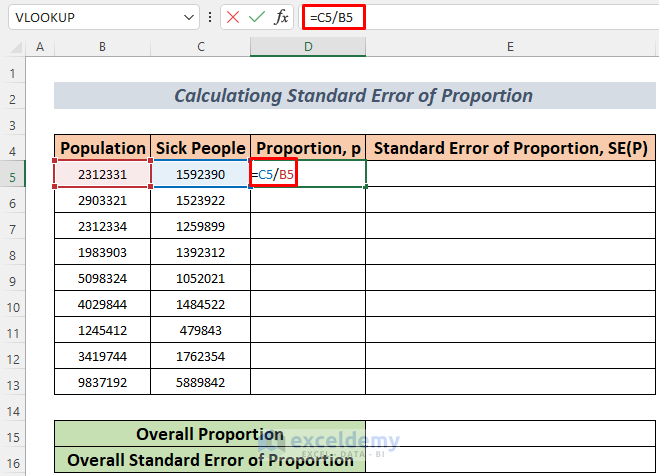
The formula will provide you with the proportion sample for the first state of the dataset.
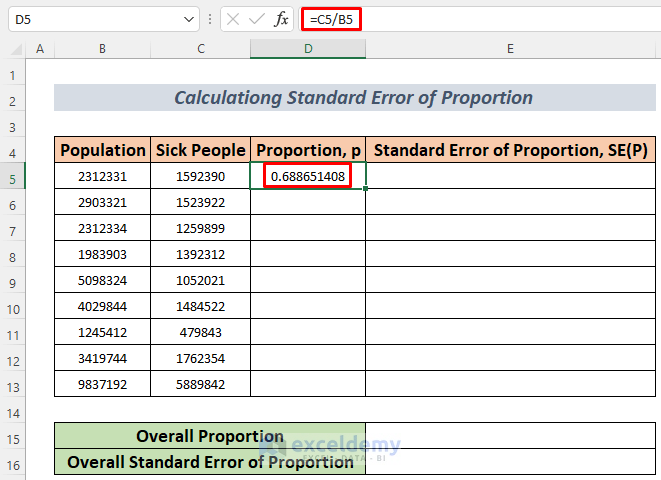
- Press the ENTER button and you will see the sample proportion for the first city.
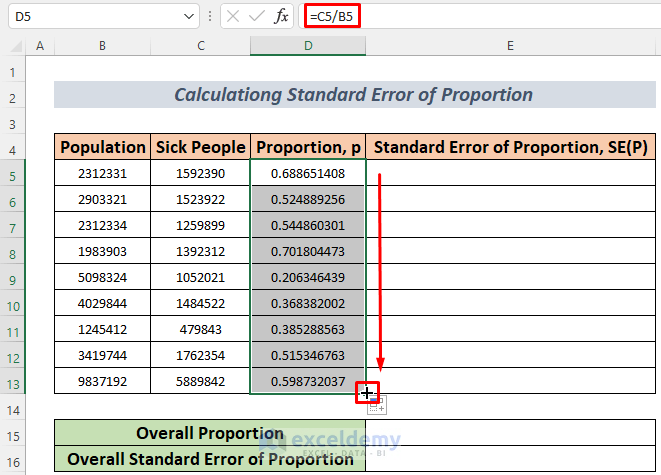
- After that, use the Fill Handle to AutoFill the lower cells.
Read More: How to Calculate SEM in Excel
Step2: Calculating Standard Error of Proportion
Now we will use the previous data to calculate the Standard Error of Proportion.
- Type the following formula in cell E5.
=SQRT(D5*(1-D5)/B5)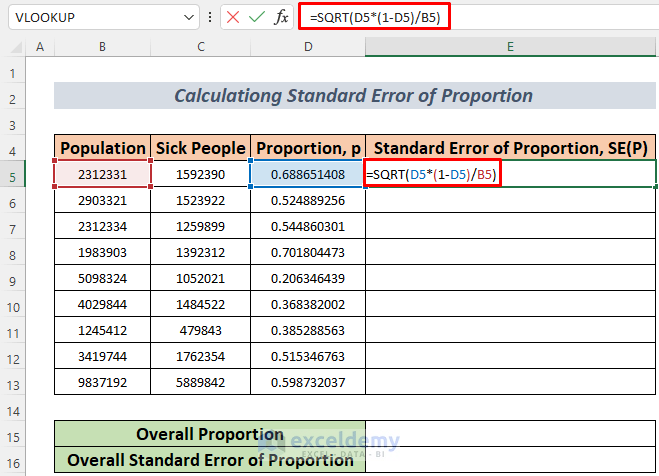
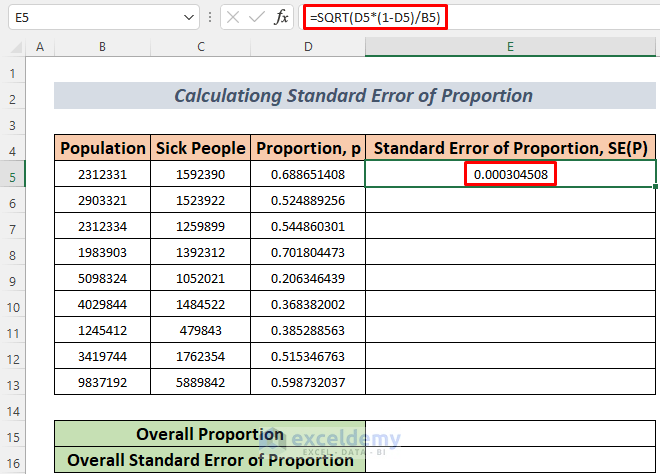
The SQRT function returns the square root of D5*(1-D5)/B5 where these cell references contain values. The value of Standard Error of Proportion in this case is 0.000304508 or 0.03%. This means the difference between the proportion and the total population is 0.03%.
- Press the ENTER button and you will see the Standard Error of Proportion for the first city.
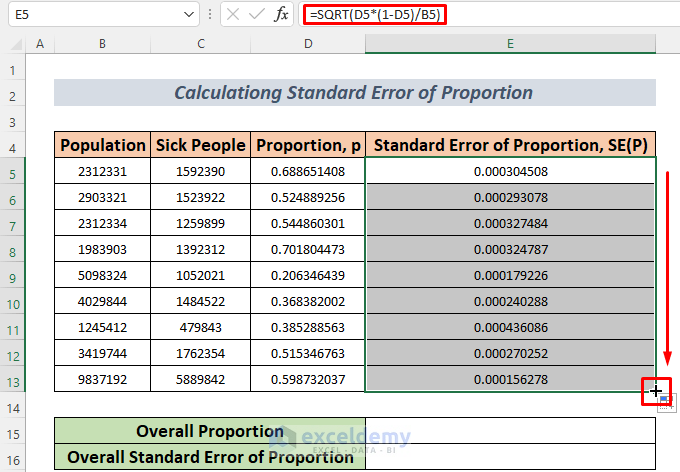
- After that, use the Fill Handle to AutoFill the lower cells. You will see all the Standard Errors of Proportion for all the states.
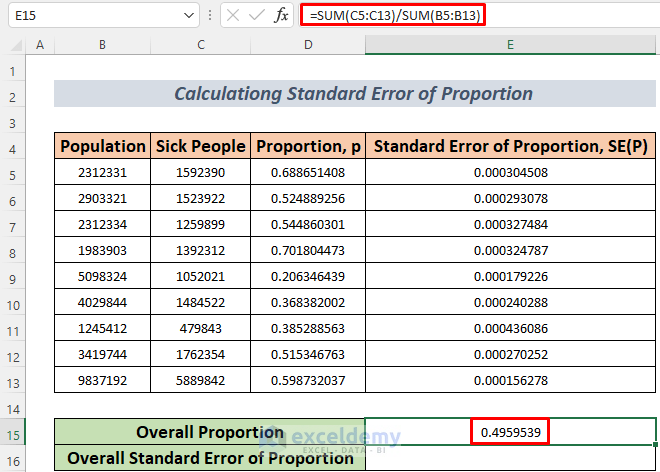
- If you want to see the overall proportion for all the states, type the following formula in cell E15.
=SUM(C5:C13)/SUM(B5:B13)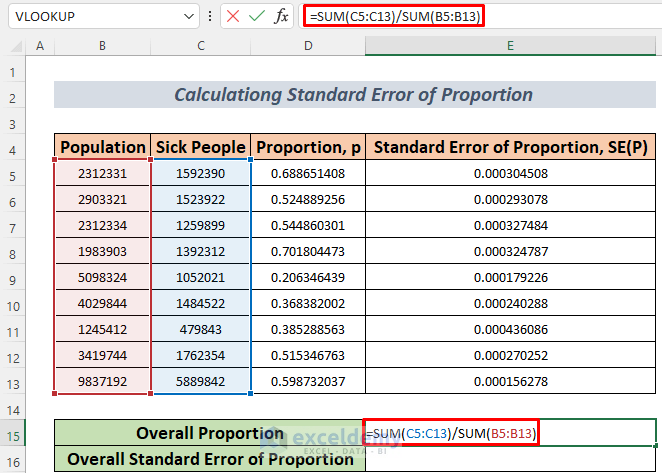
Here, the SUM Function returns the number of total sick people and population. Hence, the formula provides the Overall Proportion.
- Press the ENTER button and you will see the Overall Proportion for all the states.
- After that, write down the formula below in cell E16.
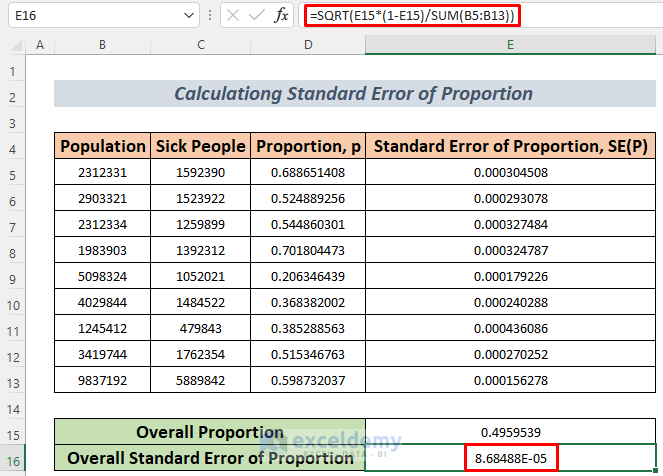
=SQRT(E15*(1-E15)/SUM(B5:B13))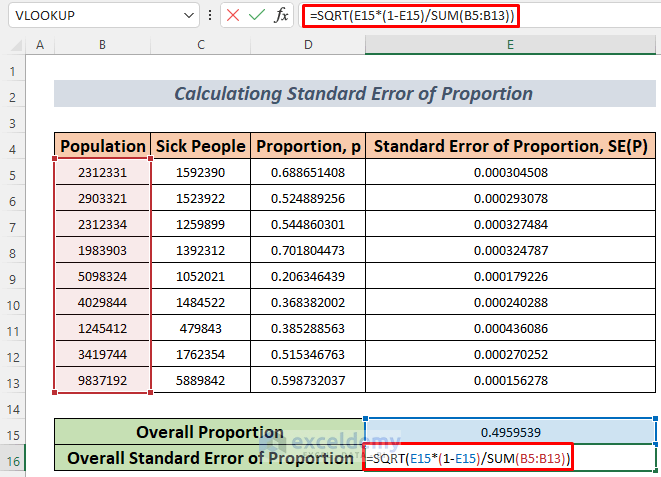
The above formula will give us the Overall Standard Error of Proportion.
- Press ENTER and you will see the overall Standard Error of Proportion.
Thus you can use Excel to calculate the Standard Error of Proportion.
Read More: How to Calculate Standard Error of Skewness in Excel
Practice Section
Here I am giving you the dataset of this article so that you can practice these steps on your own.

Download Practice Workbook
Conclusion
Suffice it to say, that you will achieve the basic knowledge to calculate the Standard Error of Proportion in Excel. You can get a better idea of predicting something with statistics using the Standard Error of Proportion. If you have any feedback regarding this article, please share it in the comment box. This will help me enrich my upcoming articles.
Related Articles
- How to Find Residual Standard Error in Excel
- How to Calculate Standard Error of Regression Slope in Excel
- How to Calculate Standard Error of Regression in Excel
- How to Calculate Standard Error of Correlation Coefficient in Excel
- How to Find Standard Error of Estimate in Excel
<< Go Back to Standard Error in Excel | Excel for Statistics | Learn Excel
Get FREE Advanced Excel Exercises with Solutions!
