If you are looking for ways to calculate SEM or Standard Error Mean in Excel, then this article is for you. SEM will indicate whether the values of the dataset are staying away or closer to the mean point of that dataset. To know more details about this statistical parameter let’s start with our main article.
How to Calculate SEM in Excel: 3 Handy Ways
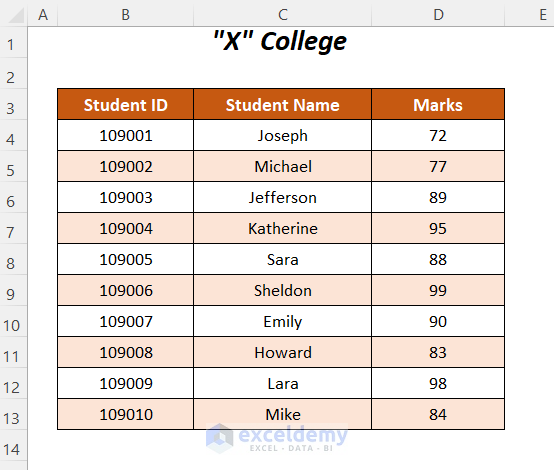
Here, we have the following dataset containing the Student IDs, Student Names, and Marks of the students. By using the following 3 ways we will determine the SEM or Standard Error Mean of the Marks.
We have used the Microsoft Excel 365 version here, you can use any other version at your convenience.
Method-1: Implementing Analysis Toolpak to Calculate SEM in Excel
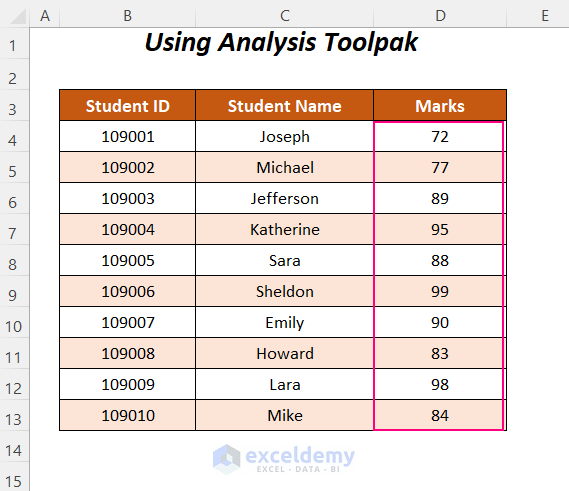
In this section, we are going to use the Descriptive Statistics option from different options of the Analysis Toolpak to calculate SEM for the following Marks of the students.
Steps:
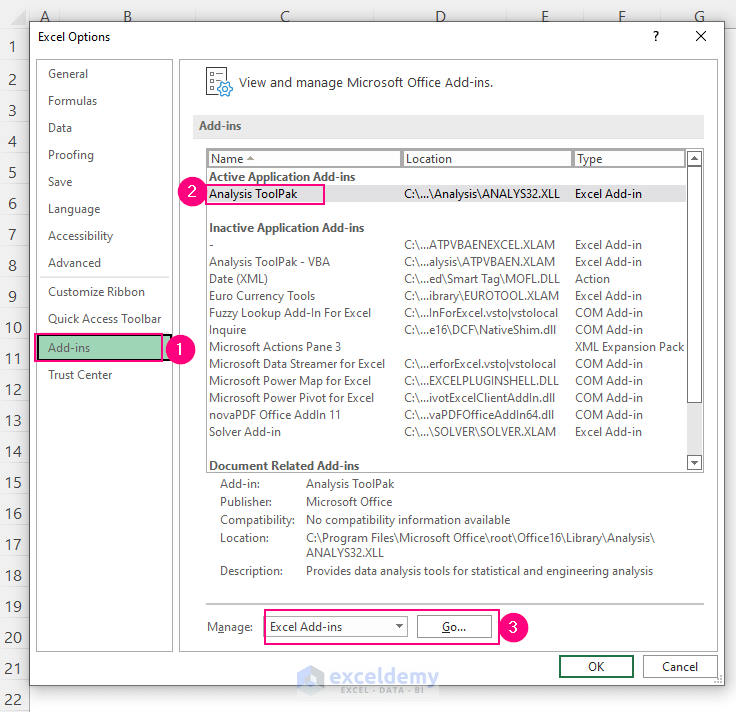
If you don’t have activated the Analysis Toolpak, then you have to activate this Analysis Toolpak first.
➤ Go to the File Tab.

➤ Select the Options Option.

After that, the Excel Options dialog box will open up.
➤ Select the Add-ins option from various options in the left pane and then choose the Analysis Toolpak in the right part.
➤ Choose the Excel Add-ins option in the Manage box and then click on the Go option.
Then, the Add-ins wizard will pop up.
➤ Check the Analysis ToolPak option and press OK.
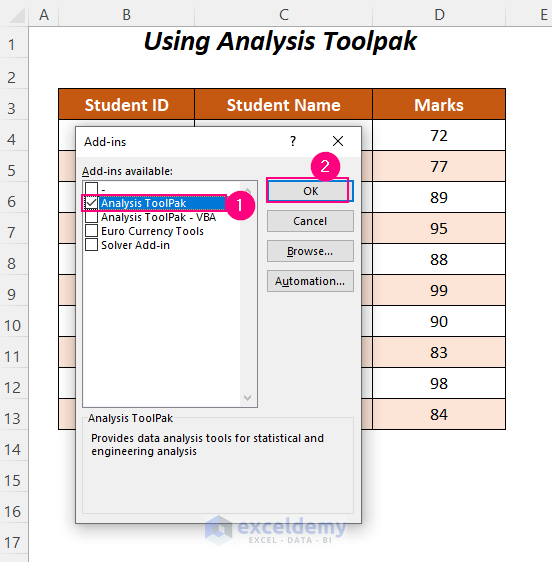
In this way, we have activated the Analysis ToolPak.
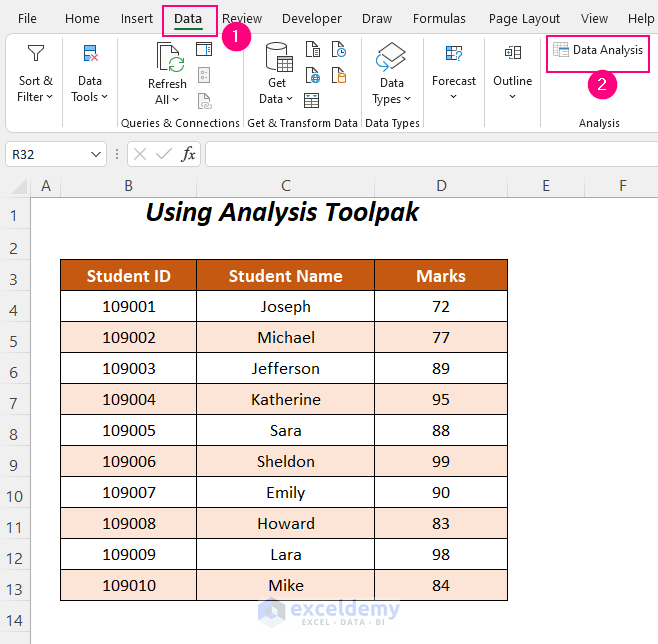
➤ Go to the Data Tab >> Analysis Group >> Data Analysis Option.
Afterward, the Data Analysis wizard will appear.
➤ Click on the Descriptive Statistics option and press OK.

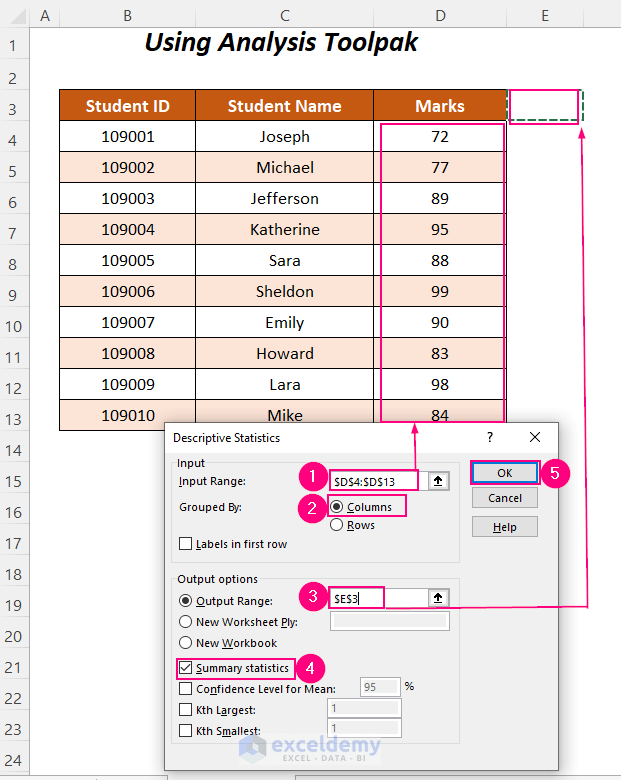
Later, you will be taken to the Descriptive Statistics wizard.
➤ Select the following.
- Input Range → $D$4:$D$13
- Grouped By → Columns
- Output Range → $E$3
➤ Check the Summary statistics option and press OK.
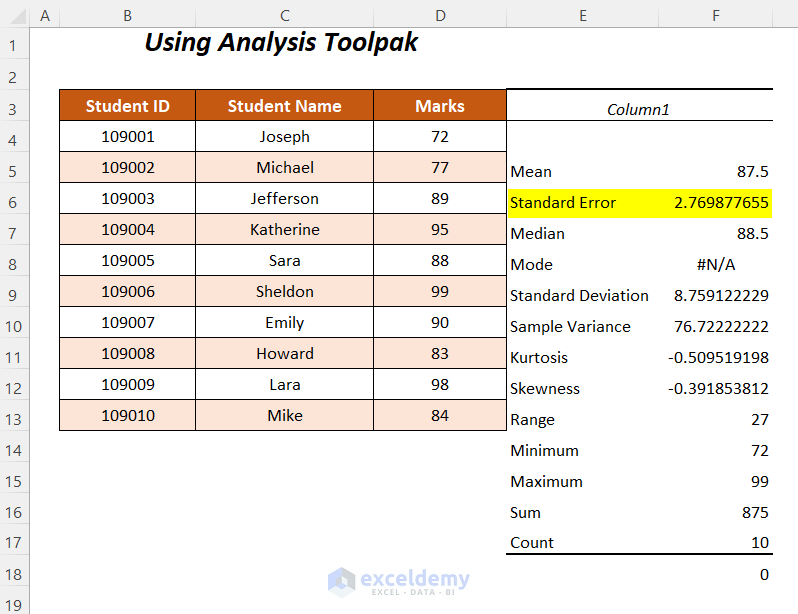
Finally, the summary of different statistical calculations will be shown in our given output range and here we have gained the Standard Error of 2.769877655 which represents the SEM value of the marks.
Read More: How to Calculate Standard Error in Excel
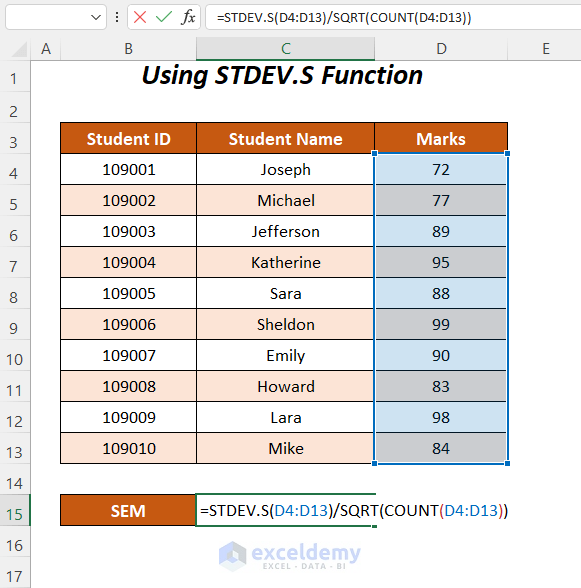
Method-2: Using STDEV.S, SQRT, and COUNT Functions to Calculate Standard Error Mean
Here, we will use the combination of the STDEV.S, SQRT, and COUNT functions to determine the SEM value of the Marks of the students. You can also use the STDEV function instead of the STDEV.S function.
Steps:
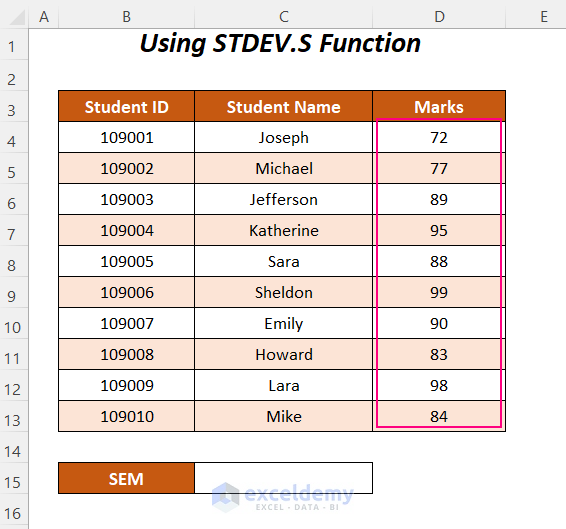
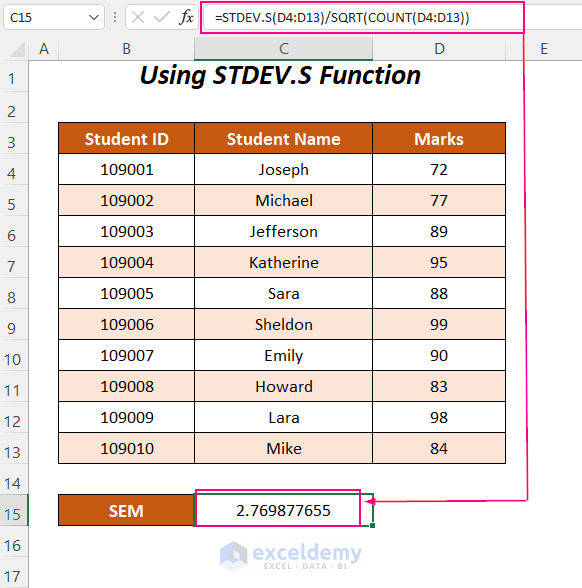
➤ Type the following formula in cell C15.
=STDEV.S(D4:D13)/SQRT(COUNT(D4:D13))Here, D4:D13 is the range of the Marks.
- STDEV.S(D4:D13) → returns the standard deviation of a list of values of the sample D4:D13.
- Output → 8.75912222898061
- COUNT(D4:D13) → counts the number of cells with numeric values.
- Output → 10
- SQRT(COUNT(D4:D13)) → gives the square root value
- Output → 3.16227766016838
- STDEV.S(D4:D13)/SQRT(COUNT(D4:D13)) → becomes
- 8.75912222898061/3.16227766016838
- Output → 2.769877655
- 8.75912222898061/3.16227766016838
➤ Press ENTER.
Then, you will get the SEM or Standard Error Mean value of the marks.
Read More: How to Find Residual Standard Error in Excel
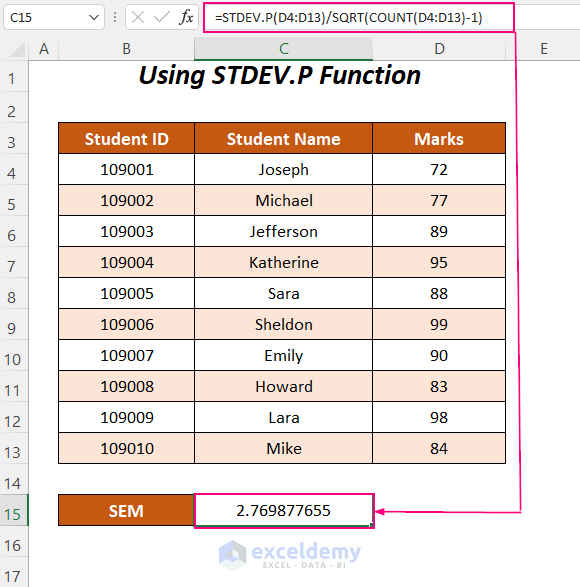
Method-3: Using STDEV.P, SQRT, and COUNT Functions to Calculate SEM in Excel
You can also use the STDEV.P function with the combination of the SQRT, and COUNT functions to calculate the Standard Error Mean value of the marks of the students.
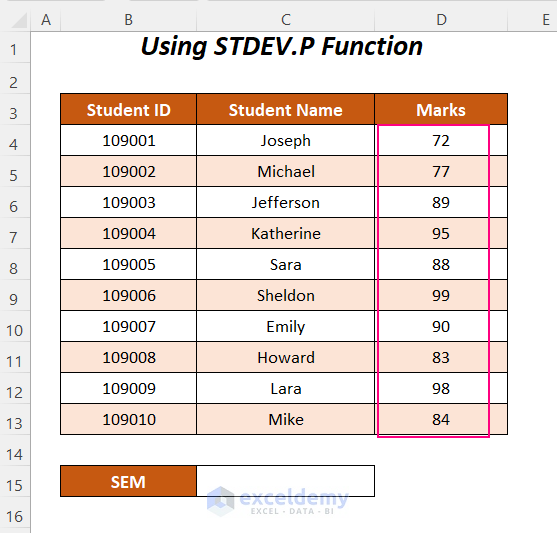
Steps:
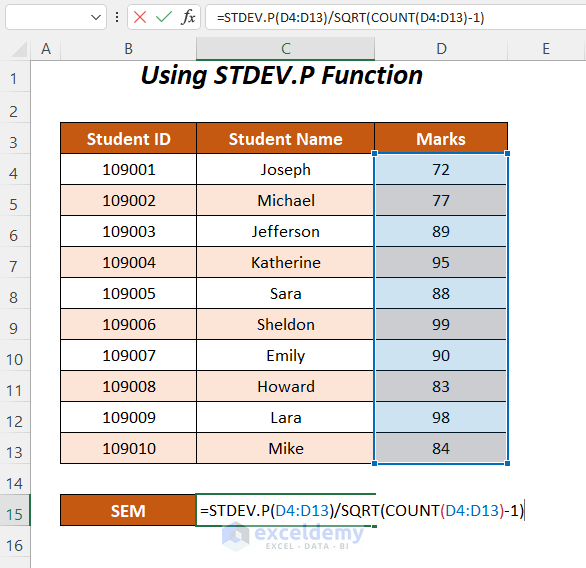
➤ Apply the following formula in cell C15.
=STDEV.P(D4:D13)/SQRT(COUNT(D4:D13)-1)Here, D4:D13 is the range of the Marks.
- STDEV.P(D4:D13) → returns the standard deviation of a list of values of the population.
- Output → 8.30963296421689
- COUNT(D4:D13) → counts the number of cells with numeric values.
- Output → 10
- SQRT(COUNT(D4:D13)-1) becomes
- SQRT(10-1) → SQRT(9) → gives the square root value
- Output → 3
- SQRT(10-1) → SQRT(9) → gives the square root value
- STDEV.P(D4:D13)/SQRT(COUNT(D4:D13)-1) becomes
- 8.30963296421689/3
- Output → 2.769877655
- 8.30963296421689/3
After pressing ENTER, you will get the desired SEM value of the Marks.
Read More: How to Calculate Standard Error of Skewness in Excel
Practice Section
For doing practice by yourself we have provided a Practice section like below in a sheet named Practice. Please do it by yourself.

Download Workbook
Conclusion
In this article, we tried to cover the steps to calculate SEM in Excel. Hope you will find it useful. If you have any suggestions or questions, feel free to share them in the comment section.
Related Articles
- How to Calculate Standard Error of Regression Slope in Excel
- How to Calculate Standard Error of Proportion in Excel
- How to Calculate Standard Error of Regression in Excel
- How to Calculate Standard Error of Correlation Coefficient in Excel
- How to Find Standard Error of Estimate in Excel
<< Go Back to Standard Error in Excel | Excel for Statistics | Learn Excel
Get FREE Advanced Excel Exercises with Solutions!
