While working with Microsoft Excel, sometimes we make a range of grouped data. In actual life, the majority of the data we deal with is organized into groups. Generally speaking, there is a lot of data and matching patterns. The range of values in a given dataset between its minimum and greatest value. Detecting the range for grouped data is among the most common kinds of data analysis. In this article, we will demonstrate some methods to calculate the range for grouped data in Excel.
What Is Range in Excel?
In an Excel document, a cell range is a group of cells that have been chosen. A worksheet’s chosen or emphasized cells are referred to as a range. A range could also be a collection of blocks of cell references that are used to store data, build a graph, or input them as arguments for functions.
What Is Range for Grouped Data in Excel?
A range is a group of values that fall in between lower and upper limits. The range is defined as the comparison of two values. In accordance with the methods, a spread is a distance between the largest and the smallest values in a set of data. The range is the difference between the maximum limit of the maximum interval and the lower bound of the lowest interval for carrier frequency distributions or grouped data. It is the most basic way to assess dispersal. It presents a thorough picture of the overall distribution of the data. As a result, the following formula is provided to determine the range of data obtained.
How to Calculate Range for Grouped Data in Excel: 3 Effective Methods
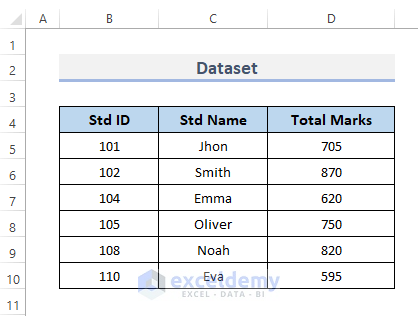
If we utilize Microsoft Excel for statistical data, we might need to locate or calculate the range for a data set. For calculating the range for grouped data, we are going to use the following dataset. The dataset contains some students’ IDs in column B, their names in column C, and the total marks they obtain out of 900 on the final exam in column D. Suppose, we need to calculate the range for total marks data. With Excel, we can easily do that. Let’s see the methods to calculate the range for grouped data.
1. Calculate Range for Grouped Data with Combination of Excel MAX and MIN Functions
The Excel statistical functions section includes the MAX and MIN functions. The MAX function returns the biggest/highest/maximum value from a set of parameters. Values obtained, cell references or ranges are all acceptable forms of argument. And, the MIN function returns the smallest/ lowest/minimum value from a set of parameters. Constants, numeric values, or ranges are all acceptable forms of argument. Both functions accept up to 255 number inputs. We can calculate the range for grouped data with the combination of these functions.
STEPS:
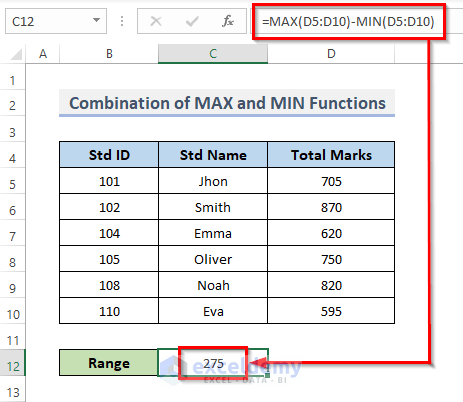
- Firstly, choose the cell in which you wish to see the data set’s range. In this case, we choose cell C12. We will use the following formula using the integers in cells D5 through D10 for this example.
- Secondly, insert the formula into that selected cell.
=MAX(D5:D10)-MIN(D5:D10)- Finally, press the Enter key on your keyboard, to complete the process.
🔎 How Does the Formula Work?
The greatest value in the data set is located using the first portion of the formula, MAX(D5:D10). The lowest value is in the second section, MIN(D5:D10). Our range is 870 – 595 = 275 since the negative sign in between subtracts MIN from MAX.
2. Combine MAX and MINIFS Functions to Compute Conditional Range for Grouped Data
The MINIFS function delivers the lowest value among the cells that meet a particular set of requirements. The logical operators (<, >, =) are supported by MINIFS. We can combine the MAX and the MINIFS function for calculating the conditional range for grouped data.
STEPS:
- To begin with, pick the cell where you want to examine the range of the data set. In this instance, we will use cell C12. For this example, we will utilize the following formula with the integers found in cells D5 through D10. Only the high value of those above 650 will include in the range calculation.
- Then, enter the formula into the cell you just chose.
=MAX(D5:D10)-MINIFS(D5:D10,D5:D10,">650")- Lastly, to finish the procedure, press the Enter key on your keyboard.

🔎 How Does the Formula Work?
The greatest value in the data set is located using the first portion of the formula, MAX(D5:D10). The second component, MINIFS(D5:D10,D5:D10,”>650″), searches for the lowest value in those cells as well. But it demands that the values in those cells be more than 650. Naturally, we subtract to get the range and use the minus symbol to do so. In this case, the maximum number is 870 and the minimum value is 705. So, after substituting the values we get 870 – 705 = 165.
3. Merge LARGE and SMALL Functions to Calculate Range for Grouped Data in Excel
The LARGE and SMALL both are under the Excel Statistical function category. The LARGE function in Excel gives back a numeric value based on its placement inside the list, whenever a condition is fulfilled by a value in decreasing order. And, the SMALL function will return numerical values that are ranked by value according to where they are in a list. We will merge these functions and calculate the range for grouped data.
STEPS:
- In the first place, select the cell where you want to see the result of the range for grouped data. So, we select cell C12.
- Next, put the following formula there.
=LARGE(D5:D10,1)-SMALL(D5:D10,1)- After that, to complete the operation hit the Enter key.

🔎 How Does the Formula Work?
We use LARGE to find the data set’s highest value (D5:D10) as the first part of the formula. The second part, SMALL contains the lowest value (D5:D10). Since the negative sign in between subtracts SMALL from LARGE, our range is 870 – 595 = 275.
Read More: How to Calculate Time Range in Excel
Download Practice Workbook
You can download the workbook and practice with them.
Conclusion
The above methods will help to calculate Range for Grouped data in Excel. Hope this will help you! Please let us know in the comment section if you have any questions, suggestions, or feedback.
Related Articles
- How to Calculate Interquartile Range in Excel
- Calculate Percentage Range in Excel
- How to Calculate Bin Range in Excel
- How to Calculate Moving Range in Excel
<< Go Back to Range Formula in Excel | Excel Range | Learn Excel
Get FREE Advanced Excel Exercises with Solutions!
