What Is Bin Range?
A histogram roughly depicts the distribution of numerical data. The first step in creating a histogram is to define the range of values using bins. Binning involves dividing the dataset into discrete intervals, and then counting the number of values that fall into each interval. These bins should not overlap, and it’s ideal for them to be of equal size and close together.
For example, consider this dataset: 1, 2, 2, 3, 3, 6, 2, 10, 3. The maximum and minimum values in this dataset are 10 and 1, respectively. If you want to divide this range into two intervals, each interval would be 5 units long (rounded from (10-1)/2 or 4.5). From 1 to 5, there are 7 data points (1, 2, 2, 2, 3, 3, 3), and from 6 to 10, there are two data points (6 and 10).
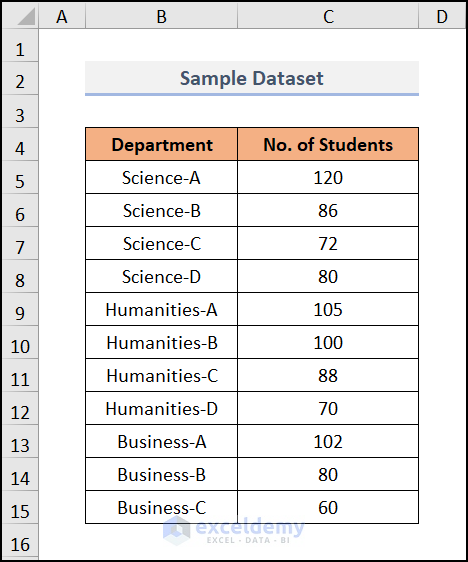
Dataset Overview
We’ll use a dataset representing the number of students enrolled in different departments.
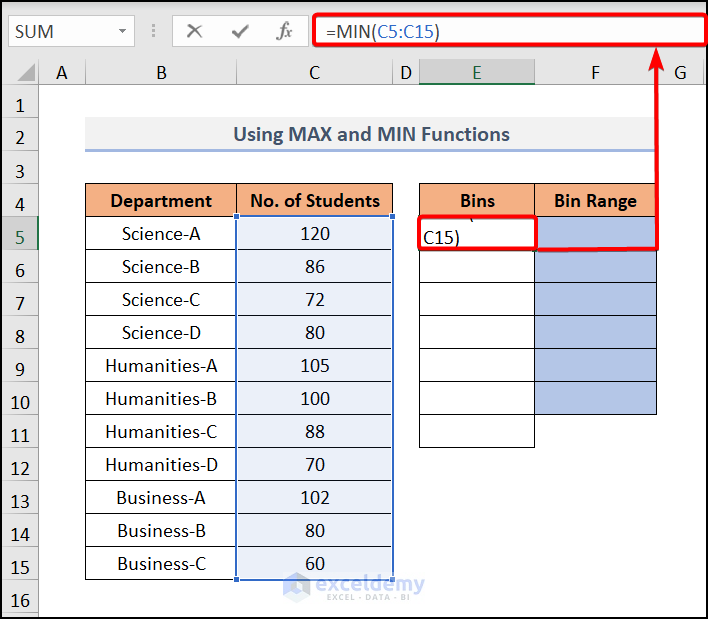
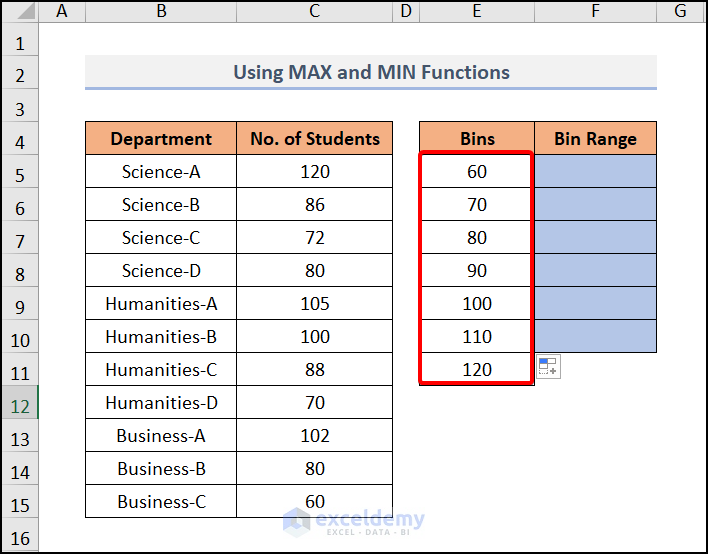
Method 1 – Using MAX and MIN Functions
- Go to cell E5 and enter the formula:
-
- This will find the minimum value from the C5:C15 range.
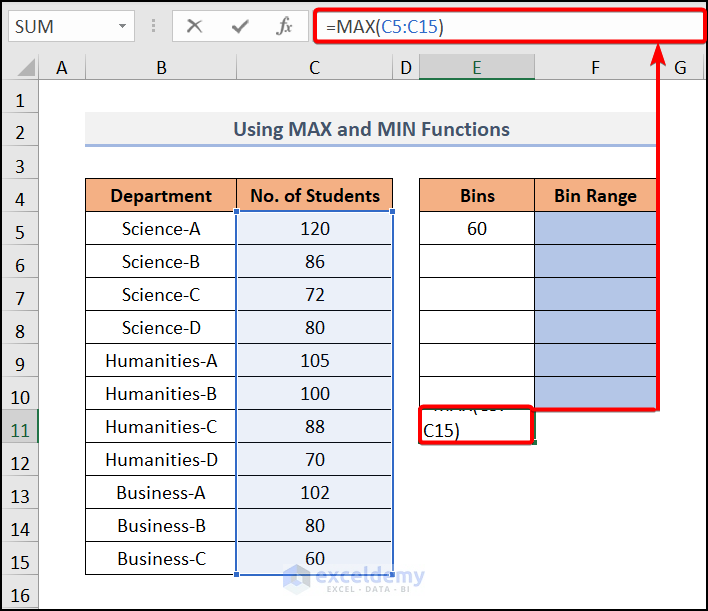
Step 2 – Determine the Upper Value
- Move to cell E11 and enter the formula:
-
- This will find the maximum value in the C5:C15 range.
- In cell E6, enter the formula:
(We’ve chosen 10 as our bin interval.)
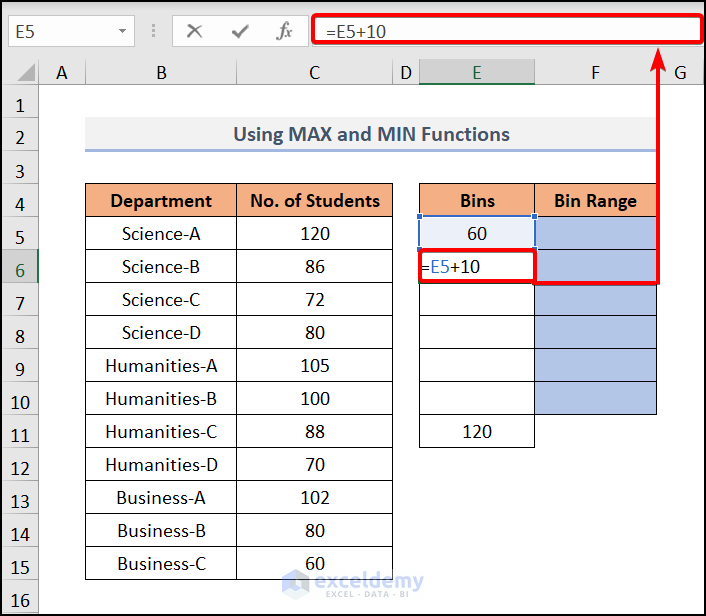
- Press ENTER and drag it down to cell E10 to get the bin intervals.
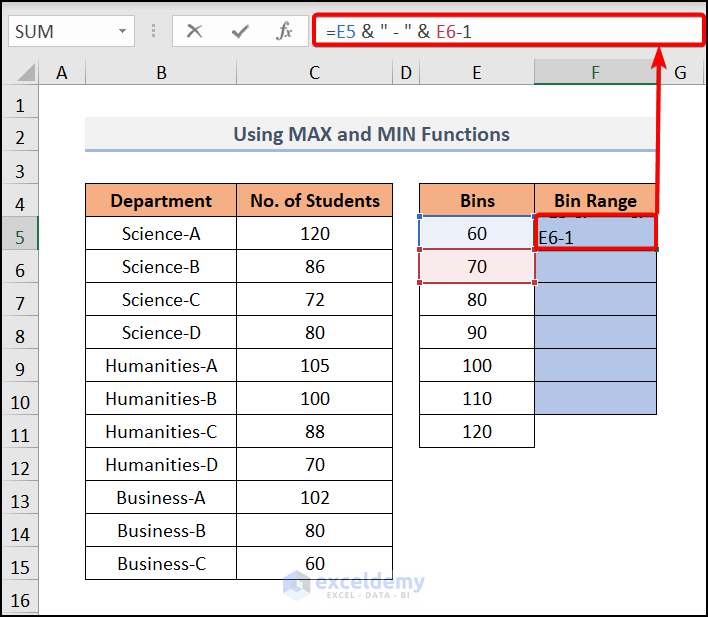
Step 4 – Calculating the Bin Range
- Select cell F5 and insert the formula:
-
- This will create a range like 60-69 after pressing ENTER.
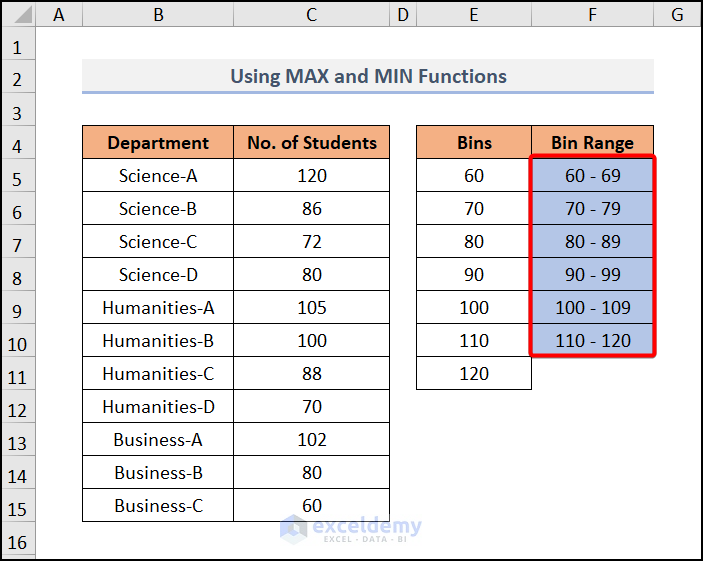
Step 5 – Drag Down the Fill Handle
- Drag down the Fill Handle tool for the other cells.
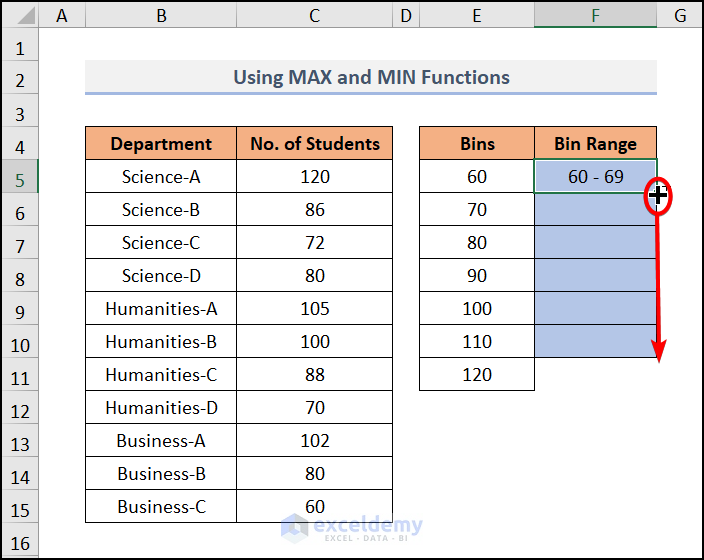
- Your desired Bin Range will be similar to the image below.
- Note: In the last cell, the formula will be:
(No need to subtract 1 from the last bin limit.)
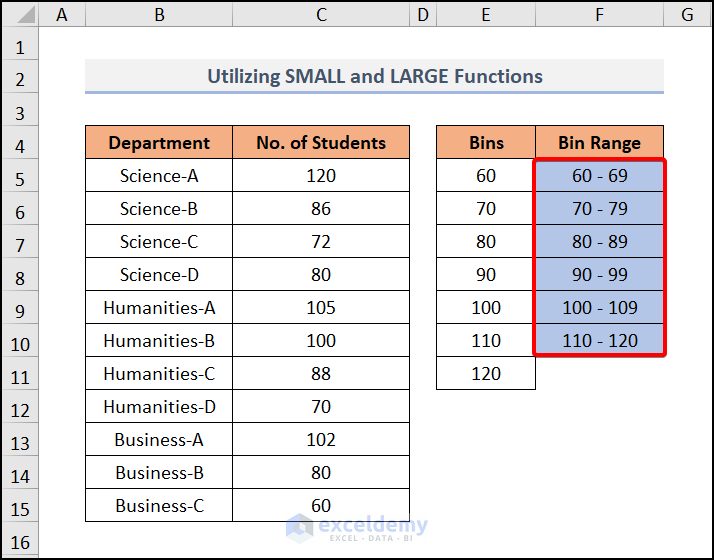
Method 2 – Utilizing LARGE and SMALL Functions
You can also find the upper and lower values by using the LARGE and SMALL functions, respectively. These functions allow you to determine the kth largest or smallest value in a dataset.
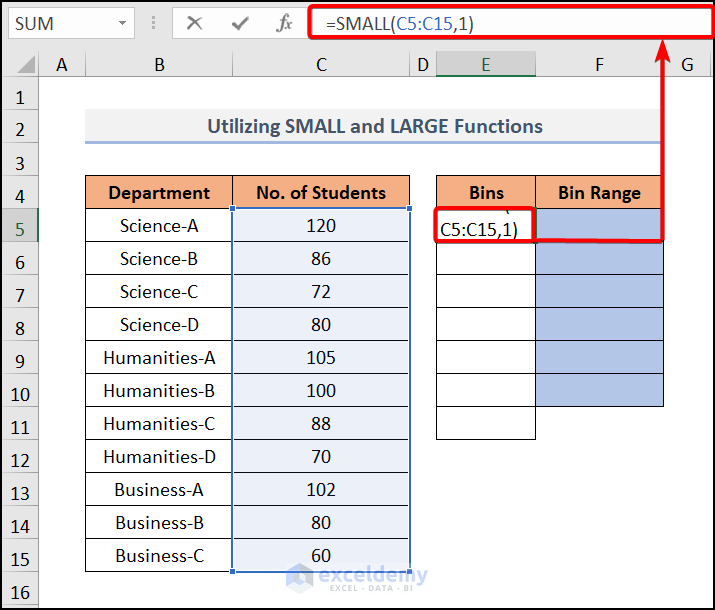
Find the Lower Value:
- Go to cell E5 and enter the formula:
The SMALL function searches for the 1st smallest value in the range C5:C15 because we specified the logical argument as 1.
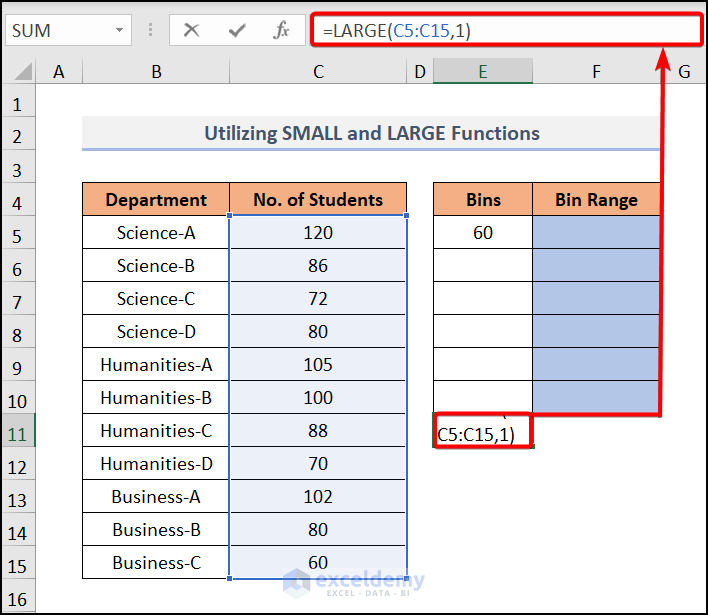
Determine the Upper Value:
- Move to cell E11 and enter the formula:
This will find the first largest value in the range C5:C15.
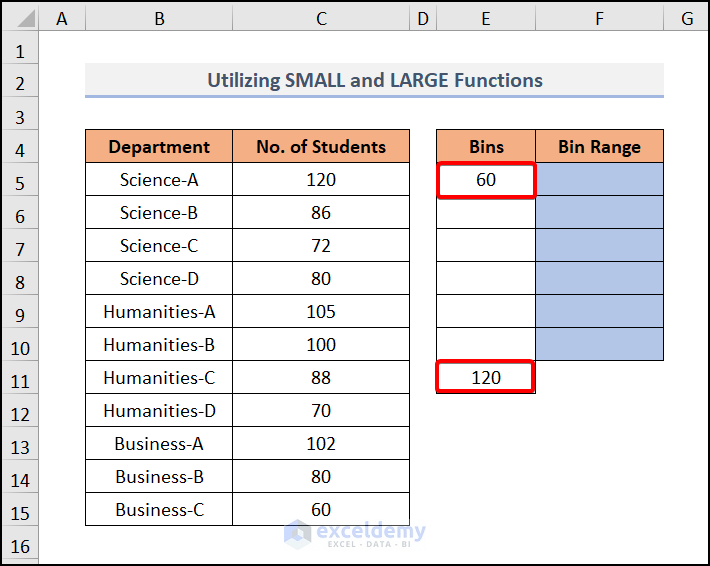
- You will get the following result.
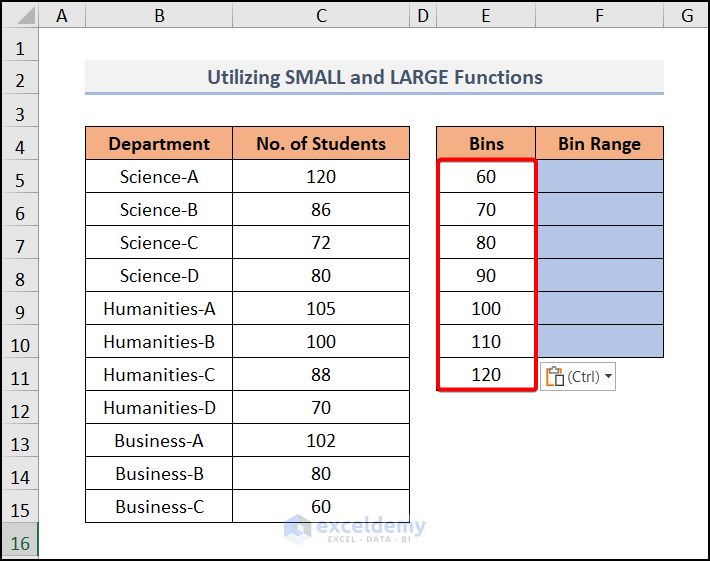
Create Bin Intervals:
- Follow Step 3 as mentioned earlier to get the bin intervals.
Calculate the Bin Range:
- In cell F5, enter the formula:
This will create a range like 60-69 after pressing ENTER.
Drag Down the Fill Handle:
- Drag down the Fill Handle tool for the other cells.
- The desired Bin Range will be similar to the image below.
Method 3 – Using the FREQUENCY Function
The Excel FREQUENCY function calculates how frequently numerical values occur within specified ranges. It provides a frequency distribution as a vertical array of values representing counts per bin. Follow these steps:
Set Up Bins and Bin Range:
- Create Bins and Bin Range following the method using MAX and MIN functions.
Calculate Frequency:
- In cell G5, enter the formula:
This function counts the numerical values within the range E5:E11 and displays them.
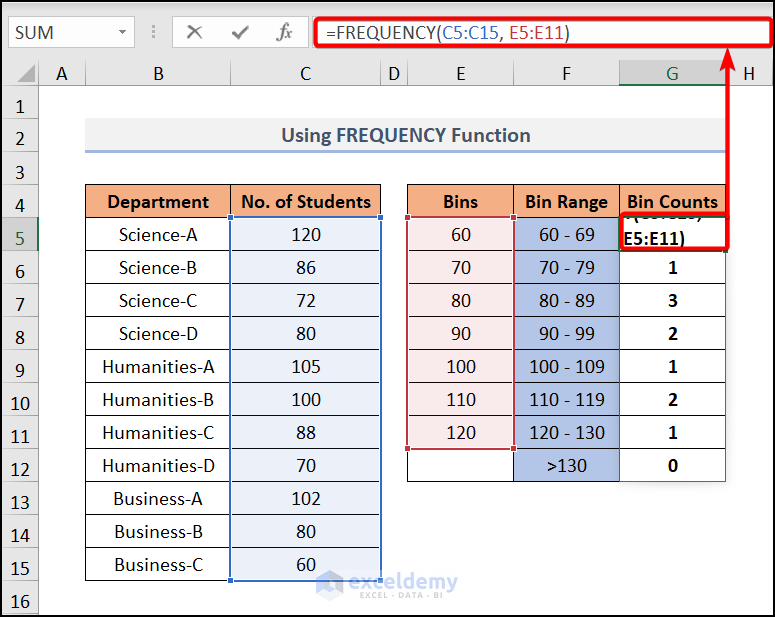
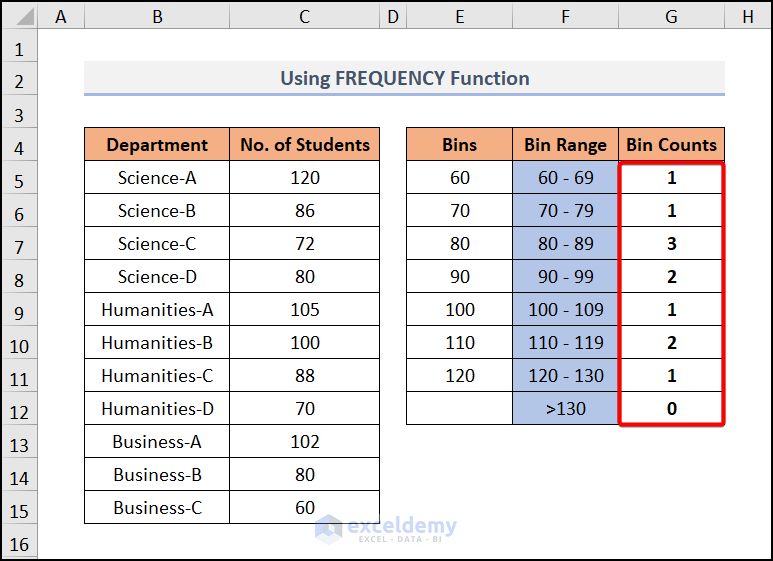
Your result will look like the image below.
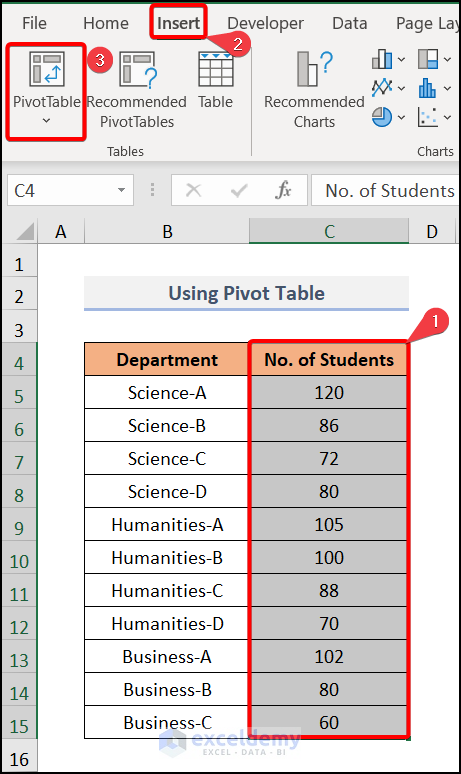
Method 4 – Using a PivotTable
You can calculate the Bin Range by creating a PivotTable. It will automatically generate the range for your dataset. Follow these steps:
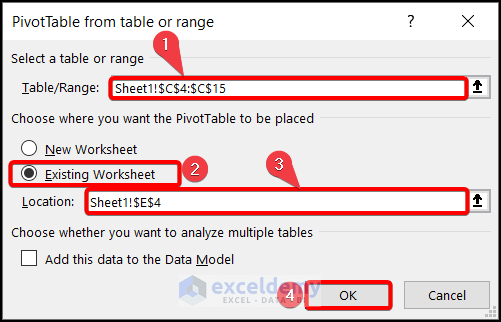
Create PivotTable:
- Select your entire data range.
- Go to the Insert tab and choose Pivot Table.
- Specify the Table/Range as Sheet1!$C$5:$C$15.
- Check the Existing Worksheet box and create the Location in Sheet1!$E$4.
- Press OK.
Configure PivotTable:
- Drag No. of Students to the Rows area.
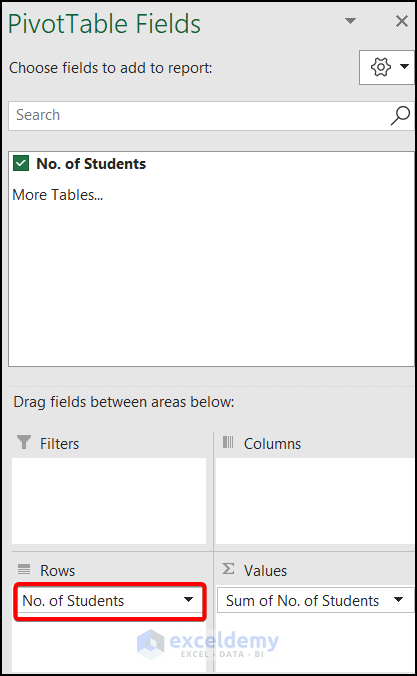
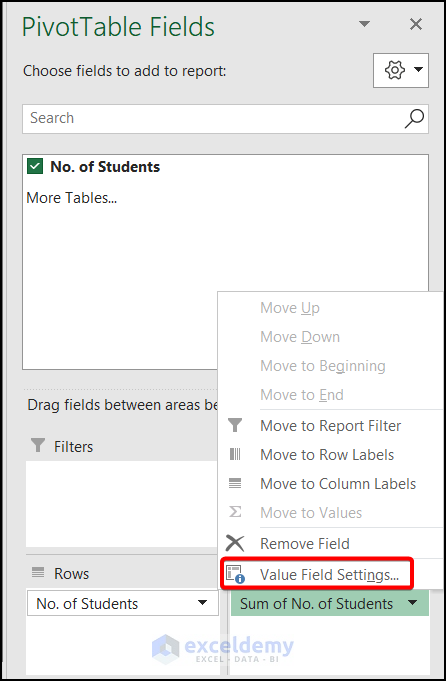
- Click on the Sum of No. of Students drop-down and select Value Field Settings.
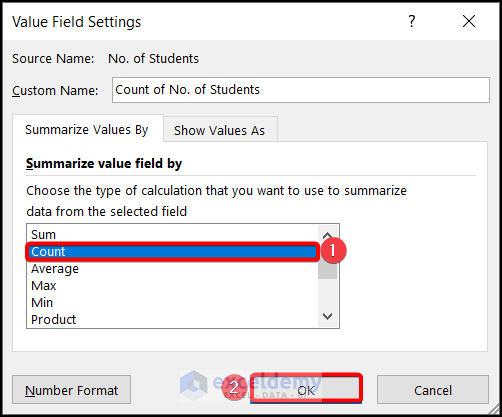
- In the Value Field Settings dialog, choose Count and hit OK.
Group Data:
- Right-click on any cell in the pivot table and select Group.
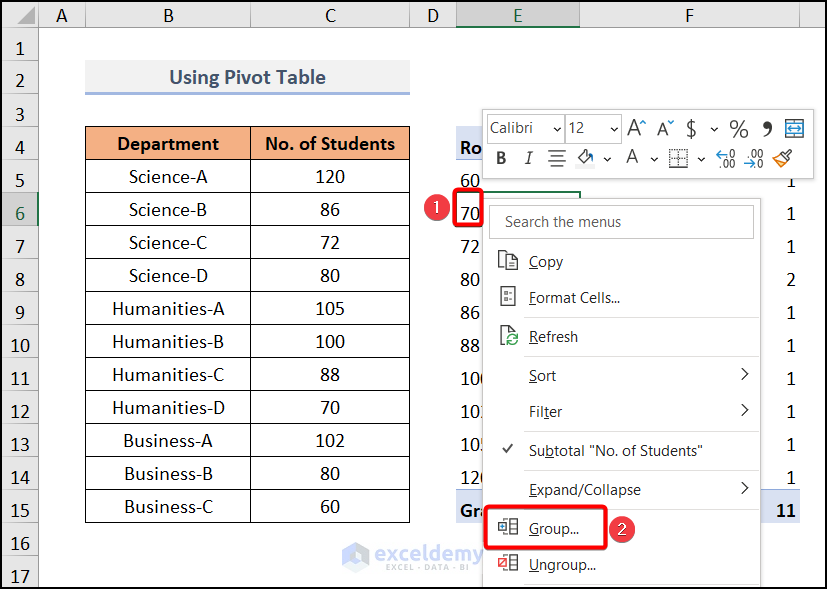
- Uncheck the Starting at and Ending at boxes.
- Set the By value to 5 (intervals of 5).
- Press OK.
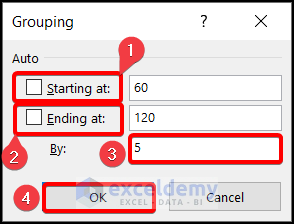
Final Result:
- You’ll get the Bin Range and Bin Counts as shown in the image below.
Let’s break down the steps for calculating a conditional bin range in Excel using two methods:
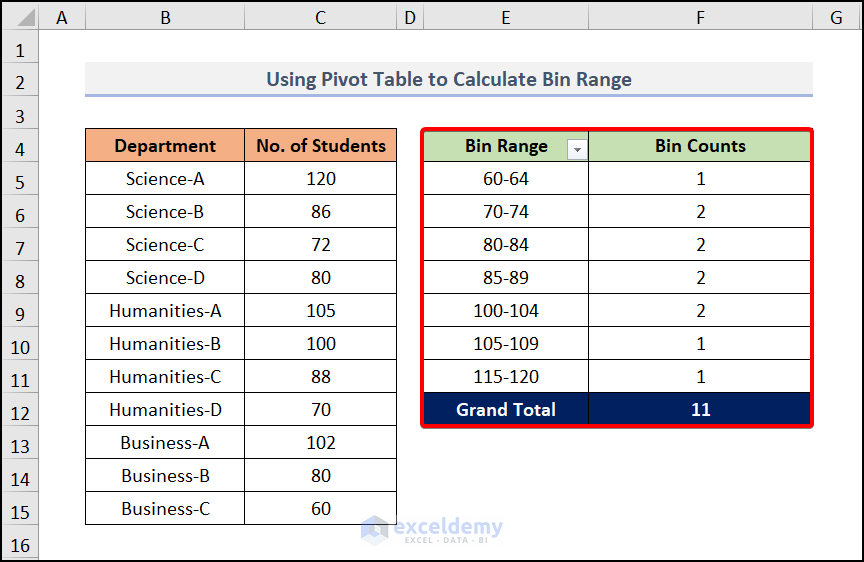
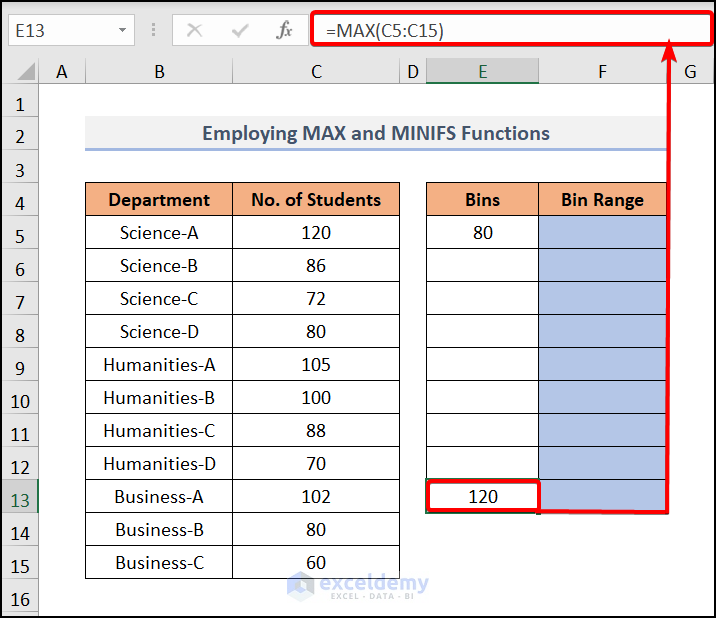
Method 1 – Employing MAX and MINIFS Functions
Find the Minimum Value (Starting from 80):
- In cell E5, enter the formula:
This formula checks for the minimum value greater than or equal to 80 in the range C5:C15.
Determine the Maximum Value (Same as Before):
- Move to cell E13 and enter the formula:
This will find the maximum value from the same range C5:C15.
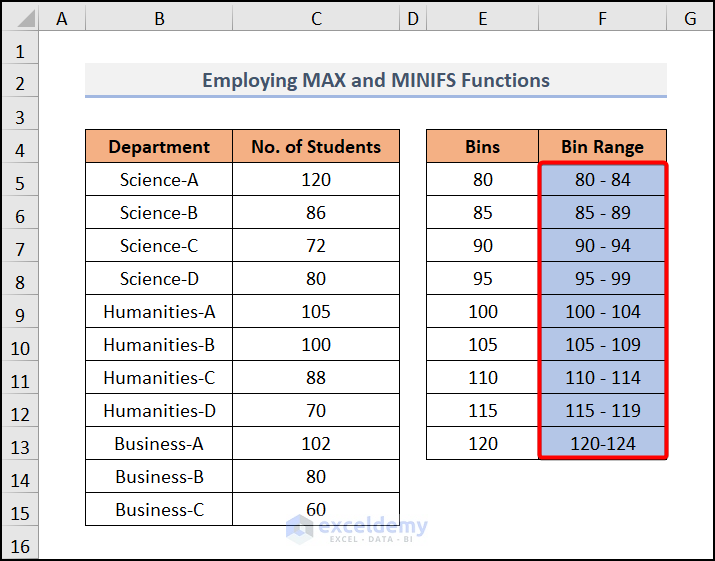
Create Bin Intervals:
- Follow Step 3 and Step 4 from the previous method to create the bin intervals and calculate the bin range.
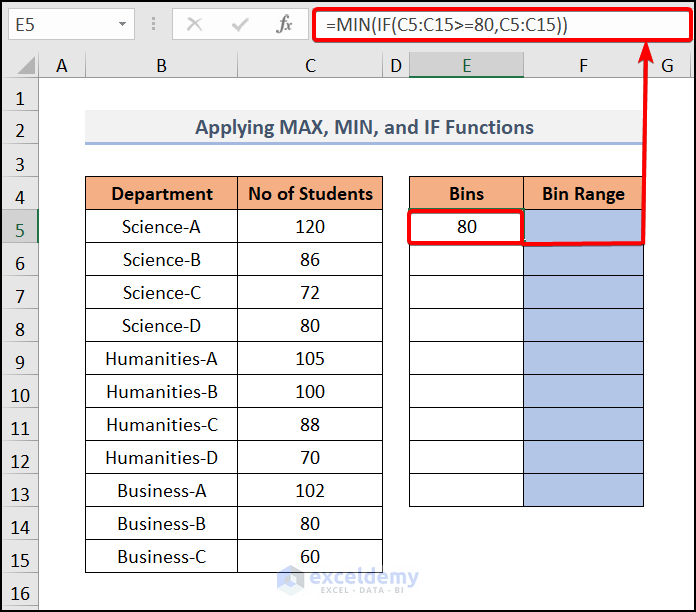
Method 2 – Applying MAX, MIN, and IF Functions
Find the Minimum Value (Starting from 80):
- In cell E5, enter the formula:
Formula Breakdown:
IF(C5:C15>=80, C5:C15)→ This function looks for values greater than or equal to 80 and returns those values.
MIN(IF(C5:C15>=80, C5:C15))→ This function then gives you the minimum value from the result of the IF function.
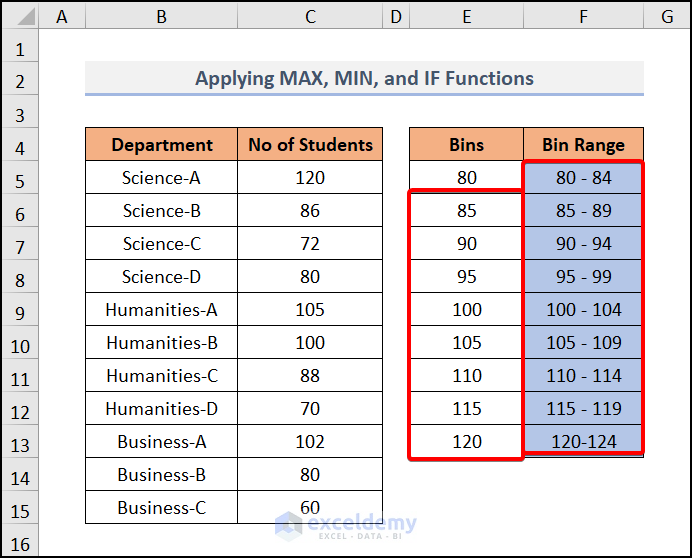
Create Bin Intervals:
- Follow Step 3 and Step 4 from the previous method to create the bin intervals and calculate the bin range.
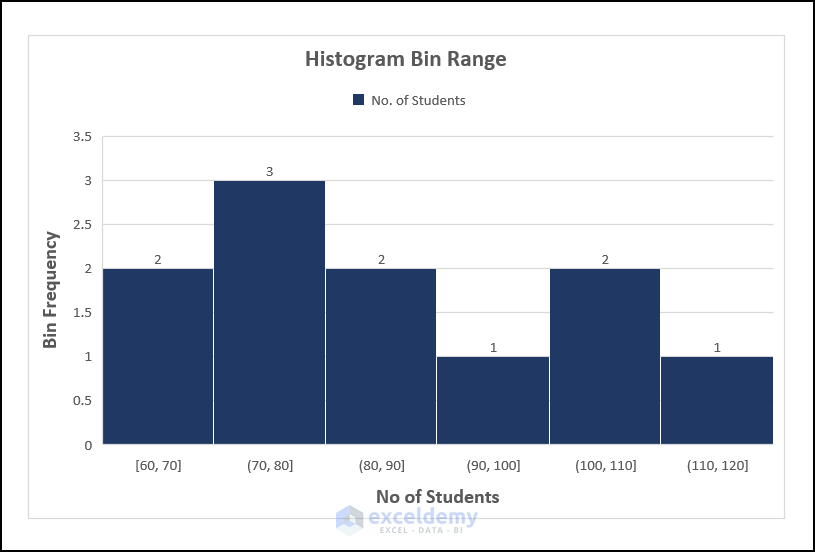
Creating a Histogram Bin Range in Excel
Select Data and Insert Histogram Chart:
- Select the entire data range.
- Go to the Insert tab and choose Statistic Chart, then select Histogram.
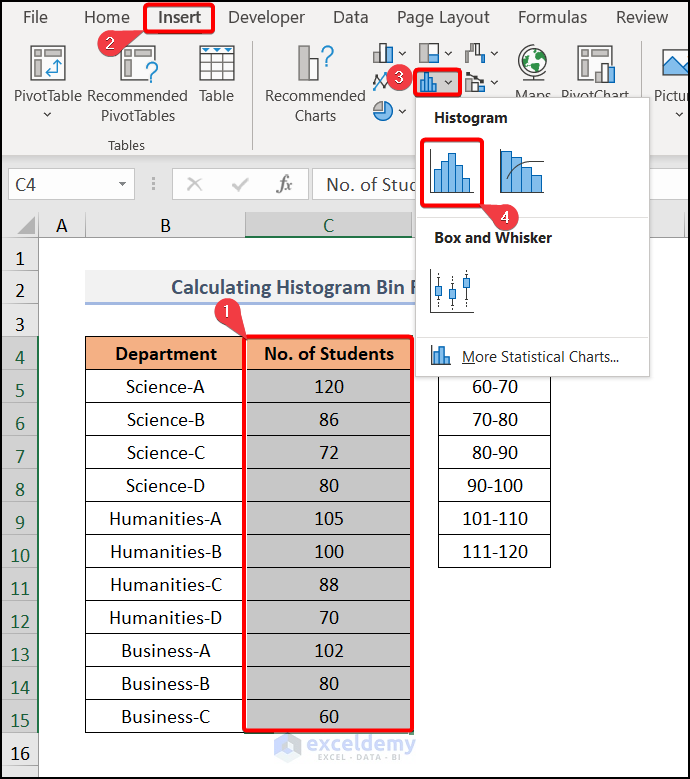
- A Histogram Chart will appear.
Format the Chart:
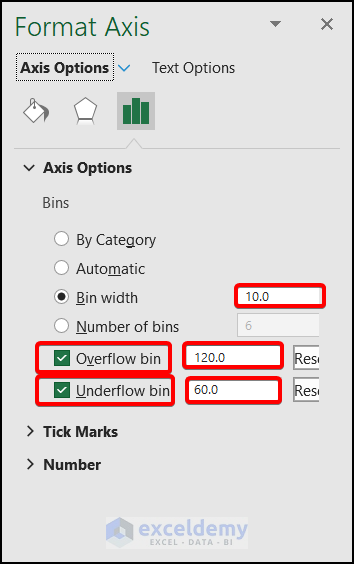
- Double-click on the X-axis value.
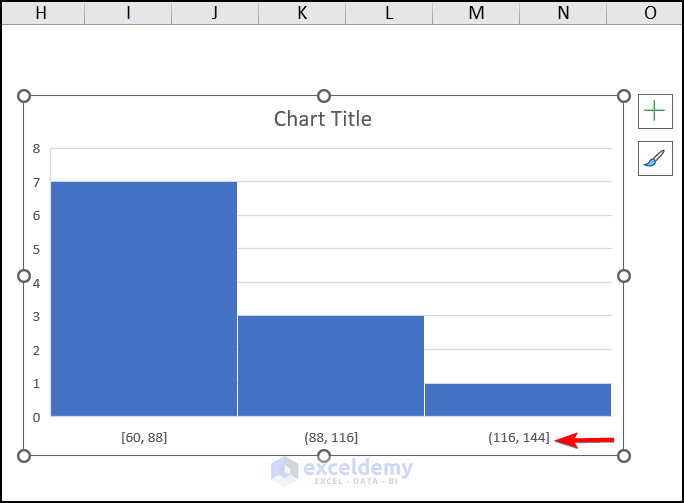
- In the Format Axis sidebar, check Overflow bin and Underflow bin.
- Set the bin width to 10.
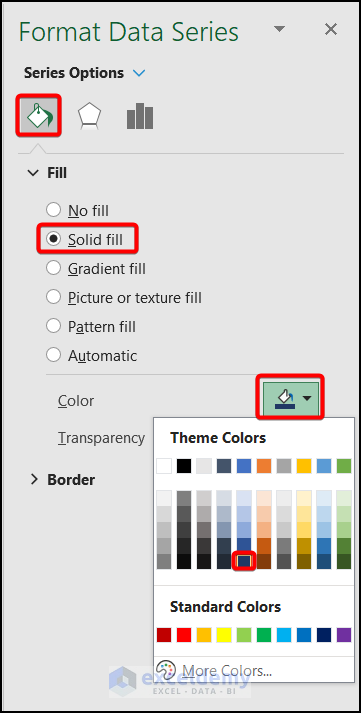
- Customize the Series Options by choosing a suitable color.
Final Result:
- After creating the axis and title, your histogram chart will look like the image below.
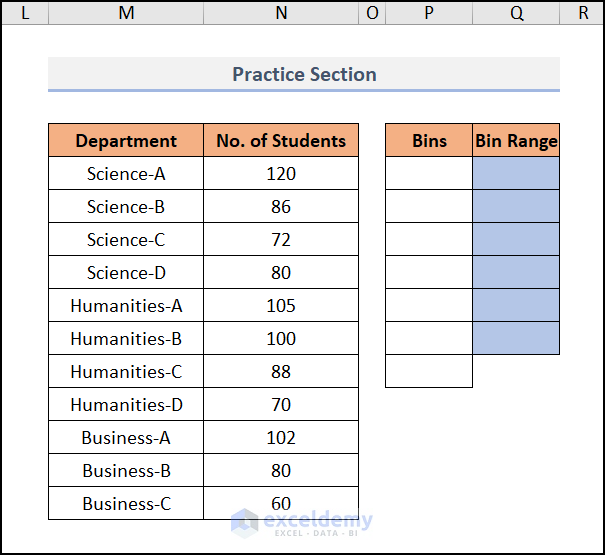
Practice Section
Feel free to practice using the provided section on each sheet.
Download Practice Workbook
You can download the practice workbook from here:
Related Articles
- Calculate Moving Range in Excel
- How to Calculate Time Range in Excel
- How to Calculate Interquartile Range in Excel
- Calculate Percentage Range in Excel
<< Go Back to Range Formula in Excel | Excel Range | Learn Excel
Get FREE Advanced Excel Exercises with Solutions!
