This article will focus on the AGGREGATE vs SUBTOTAL functions of Microsoft Excel. The AGGREGATE function in Excel contains nineteen distinct functions for achieving the desired results. Whereas in Microsoft Excel, SUBTOTAL is one of the strong functions that comes with nine different functions. These functions allow you to do a variety of Excel function operations.
Syntax of AGGREGATE Function:
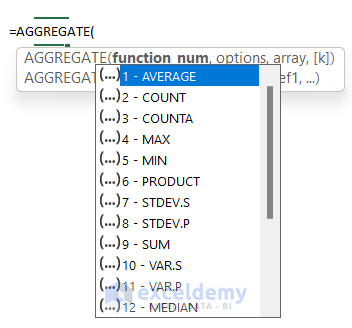
Reference form: AGGREGATE(function_num, options, ref1, [ref2], …)
Array form: AGGREGATE(function_num, options, array, [k])
Syntax of SUBTOTAL Function:
SUBTOTAL(function_num,ref1,[ref2],…)

With examples and adequate representations, we will explain the distinctions between the AGGREGATE and SUBTOTAL functions in Excel in this post.
AGGREGATE vs SUBTOTAL in Excel: 4 Differences
While using the AGGREGATE vs SUBTOTAL functions in Excel, we noticed some differences. Here are they-
1. Unlike AGGREGATE, (Available Since 2010), SUBTOTAL Function Is Available in Excel Since 2007
AGGREGATE Function:
The AGGREGATE function is compatible with Excel for Microsoft 365, Excel for Microsoft 365 for Mac, Excel for the web, Excel 2021, Excel 2021 for Mac, Excel 2019, Excel 2019 for Mac, Excel 2016, Excel 2016 for Mac, Excel 2013, Excel Web App, Excel 2010, Excel for Mac 2011, Excel Starter 2010.
SUBTOTAL Function:
The SUBTOTAL function is accessible in Microsoft 365, Microsoft 365 for Mac, Excel for the web Excel 2021, Excel 2021 for Mac, Excel 2019, Excel 2019 for Mac, Excel 2016, Excel 2016 for Mac, Excel 2013, Excel 2010, Excel 2007, Excel for Mac 2011, Excel Starter 2010.
2. SUBTOTAL Function Let You Specify Whether to Include or Exclude Hidden or Filtered Rows
The AGGREGATE function is preferable to SUBTOTAL since it has more functions and features. SUBTOTAL, on the other hand, allows us to decide whether to include or omit manually hidden rows. However, both functions can exclude manually concealed and filtered-out rows from the assessment.
i. Dealing with Hidden Rows
For data manipulation, sometimes we have to hide or unhide rows. Now we will see the effect of hiding on the AGGREGATE and SUBTOTAL functions.
📌 Steps:
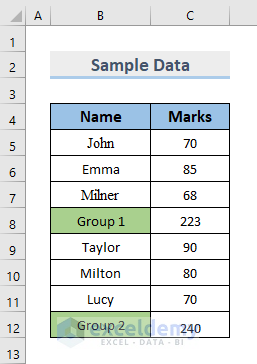
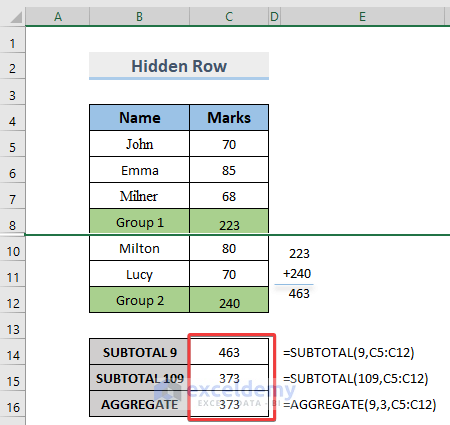
- First and foremost, here is a data collection including two groups of students and their class Marks on a certain subject. The Group 1 and Group 2 cells in B8 and B12 are the total marks of the corresponding groups.
- With the AGGREGATE function, you may conduct 19 different functions. Individual integers define each function. In addition, the SUBTOTAL function provides 11 Excel functions that may be performed by inputting the relevant parameter.
- MS Excel includes a SUM function that returns the SUM of numbers, however, when there is a SUM Function in the range, such as the cells in C8 and C12, the overall summation of the outcome might be deceptive. To solve this problem, Excel has AGGREGATE and SUBTOTAL functions to find the sum and many other functions to ignore the sub summation in the range like in the image below.
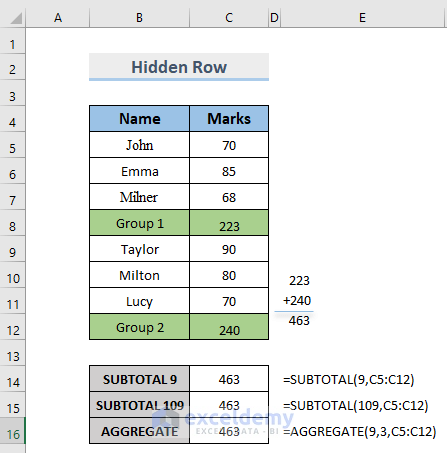
- In cell C14, the following formula is used to find the sum of 2 groups:
=SUBTOTAL(9,C5:C12)- SUBTOTAL(function_num,ref1,[ref2],…)
- function_num= 9 (SUM)
- ref1= C5:C12
- The following formula is used to find the sum of 2 groups in cell C15:
=SUBTOTAL(109,C5:C12)Here,
- SUBTOTAL(function_num,ref1,[ref2],…)
- function_num= 109(SUM)
- ref1= C5:C12
- Again, the following formula is used to find the sum of 2 groups in cell C16:
=AGGREGATE(9,3,C5:C12)
- AGGREGATE(function_num, options, ref1, ref2, …)
- function_num= 9(SUM)
- options= 3
- ref1= C5:C12
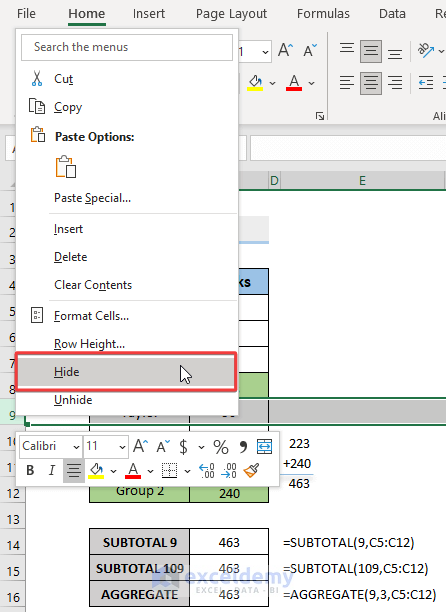
- Now we will hide a row to see the effect on the functions and their corresponding different functionality.
- Select Row 9 and right click on the mouse and then select Hide.
- This number in the SUBTOTAL function, which can range from 1 to 11 or 101 to 111, indicates which function will be used for the SUBTOTAL. 1-11 functions in SUBTOTAL purposefully ignore concealed rows, however, 101-111 do not; filtered-out cells are always omitted.
- options 3 in AGGREGATE purposefully ignores concealed rows.
- For that reason, C14 is unchanged with hidden rows. However, C15 and C16 have been changed.
ii. Dealing with Filtered Data
Filtering rows is sometimes required for data modification. Now we’ll look at how filtering affects the AGGREGATE and SUBTOTAL functions.
📌 Steps:
- Now we will add a Filter to the data like the image below to observe the effect on those functions.
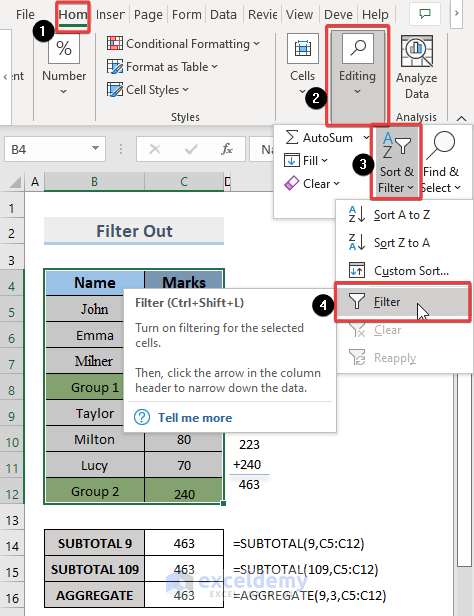
- After adding Filter, we will click on the drop-down menu to filter out Group 1 and Milton and press OK.
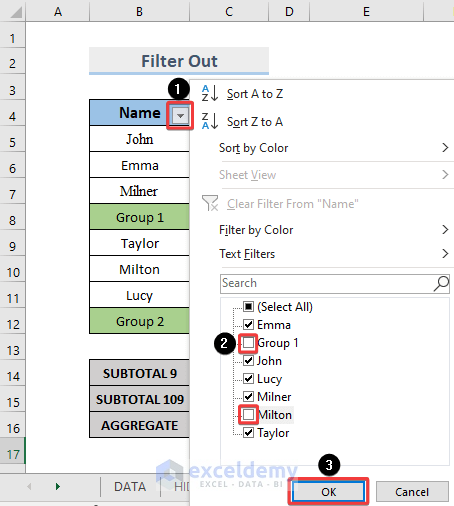
- Like in the image, filtering out data does not show any different effect on the two functions. SUBTOTAL and AGGREGATE functions both are sensitive to filter out data.

3. AGGREGATE Function Can Deal with Input Range That Has Erroneous Values in It
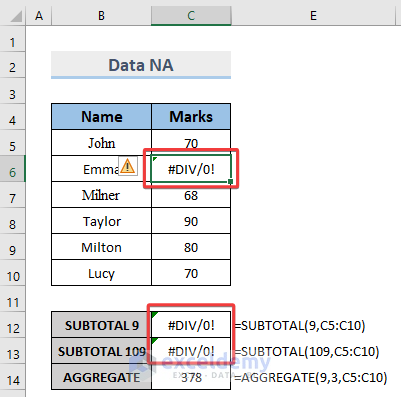
Cells containing invalid data like #DIV/0! are a major obstacle to data modification. We’ll look at how invalid data affects the AGGREGATE and SUBTOTAL functions.
📌 Steps:
- Now the ultimate difference between SUBTOTAL and AGGREGATE functions is that AGGREGATE can ignore error values whether SUBTOTAL can’t.
4. AGGREGATE Offers 10 More Functions Compared to SUBTOTAL Function
SUBTOTAL has 9 different functions inside it while AGGREGATE has 10 more functions which makes it more diverse than SUBTOTAL.
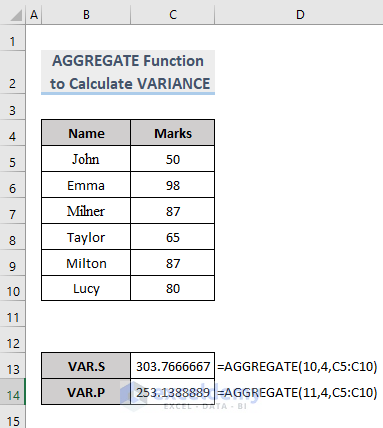
i. VAR.S (Function Number 10) and VAR.P (Function Number 11)
You must utilize the VAR.S function, which is function number 10, to compute the VARIANCE of a sample dataset with the AGGREGATE function. To determine the VARIANCE of an entire population, utilize Excel’s VAR.P function, which is function number 11.
Read More: How to Use Conditional AGGREGATE Function in Excel
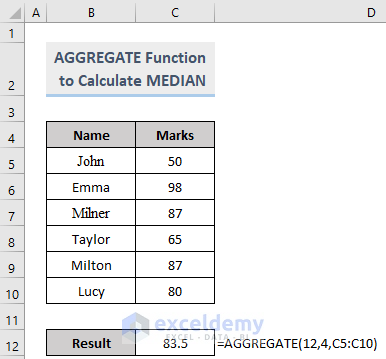
ii. MEDIAN (Function Number 12)
In Excel, the MEDIAN function returns the data set’s middle number.
We obtained the expected output, 83.5, in our result cell after applying the MEDIAN function with the aid of the AGGREGATE function.
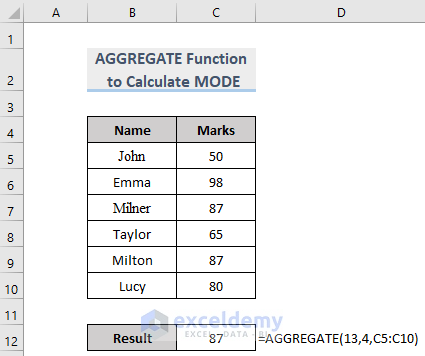
iii. MODE.SNGL (Funciton Number 13)
The MODE.SNGL function returns the value that occurs the most frequently inside a given range. In Excel, this is also a statistical function.
Take the following example, in which 87 appears twice while the remaining digits appear just once.
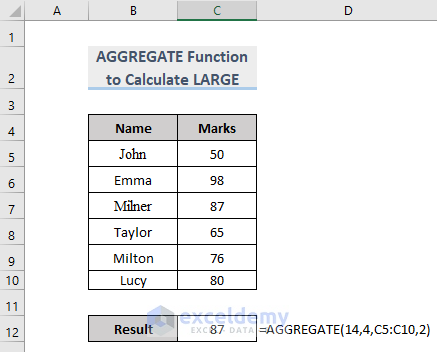
iv. LARGE (Function Number 14)
The LARGE function returns the largest number in a given sample. It has function number 14, which indicates that when we run this function with the AGGREGATE, we must include the [k] as the fourth argument.
- Now we will enter the following formula in C12:
=AGGREGATE(14,4,C5:C10,2)14 = function number, which means the LARGE function
4 = option, which means we will ignore nothing
C5:C10 = cell references that have the values to extract the result
2 = 2nd largest value (if you want to get the largest value within a dataset then write 1, if you want to get the 3rd largest value then write 3, and so on)
- In our dataset, the highest value is 98. However, because we used 2 in the k-th option, we intended to have the 2nd greatest number in our dataset. Because 87 is the second largest, we received 87 as our output.
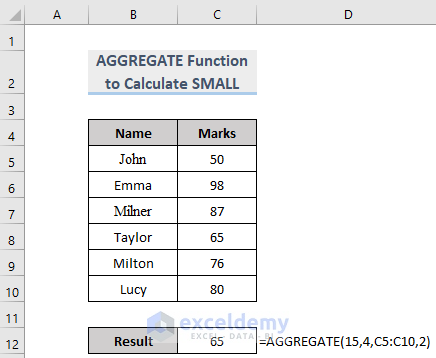
v. SMALL (Function Number 15)
The SMALL function in Excel delivers the smallest integer in each dataset. As previously explained, while running this function with the AGGREGATE, we must put the [k] as the fourth parameter.
- At this moment, in C12, we will enter the following formula:
=AGGREGATE(15,4,C5:C10,2)
15 = function number means the SMALL function
4 = option, which means we will ignore nothing
C5:C10 = cell references that have the values to extract the result
2 = 2nd smallest value (if you want to get the smallest value within a dataset then write 1, if you want to get the 3rd smallest value then write 3, and so on)
- In our dataset, the smallest value is 50. However, because we used 2 in the k-th option, we intended to have the 2nd smallest number in our dataset. Because 65 is the second smallest, we received 65 as our output.
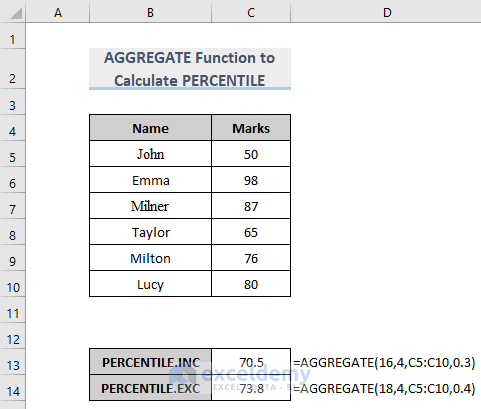
vi. PERCENTILE.INC (Function Number 16) and PERCENTILE.EXC (Function Number 18)
The PERCENTILE function computes the k-th percentile given a piece of data. A percentile is a number that represents the percentage of values in a data collection that fall below that value. The value of k might be either a decimal or a percentage. In other words, the number for the tenth percentile should be entered as 0.1 or 10%. A percentile computed with 0.2 as k, for example, implies that 20% of values are less than or equal to the calculated result, but a percentile calculated with 0.5 as k means that 50% of values are less than or equal to the calculated result.
- Again, in C12, we will enter the following formula:
=AGGREGATE(16,4,C5:C10,0.3)
=AGGREGATE(18,4,C5:C10,0.4)
16= function number means the PERCENTILE.INC function
18= function number means the PERCENTILE.EXC function
4 = option, which means we will ignore nothing
C5:C10 = cell references that have the values to extract the result
0.3= 30% of values are less than or equal to the calculated result
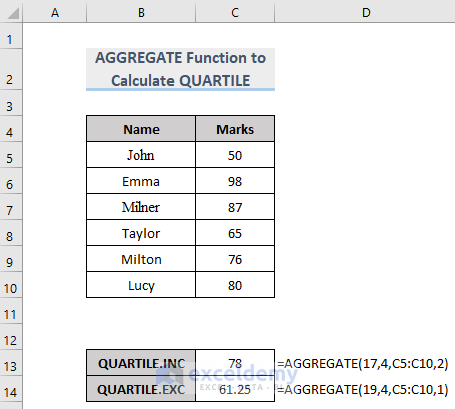
vii. QUARTILE.INC (Function Number 17) and QUARTILE.EXC (Function Number 19)
The QUARTILE function in Excel returns the quarter part (four equal groups) of a total set of data.
- Now to calculate QUARTILE, we will enter the following formula:
=AGGREGATE(17,4,C5:C10,2)
=AGGREGATE(19,4,C5:C10,1)
17= function number means the QUARTILE.INC function
19= function number means the QUARTILE.EXC function
4 = option, which means we will ignore nothing
C5:C10 = cell references that have the values to extract the result
2= Second quartile, 50th percentile
1= first quartile, 25th percentile
Download Practice Workbook
You can download the practice workbook from the following download button.
Conclusion
To discern between AGGREGATE vs SUBTOTAL in Excel, follow these procedures and stages. You are invited to download and use the workbook for your own practice. Please post any questions, problems, or recommendations in the comments box.
Related Articles
- How to Aggregate Data in Excel
- How to Aggregate COUNTIF in Excel
- AGGREGATE Formula for Adding Serial Number in Excel
- How to Use Excel AGGREGATE Function with Multiple Criteria
- How to Combine INDEX and AGGREGATE Functions in Excel
- Use AGGREGATE to Achieve MAX IF Behavior in Excel
- Combining AGGREGATE with IF Function in Excel
<< Go Back to Excel AGGREGATE Function | Excel Functions | Learn Excel
Get FREE Advanced Excel Exercises with Solutions!
