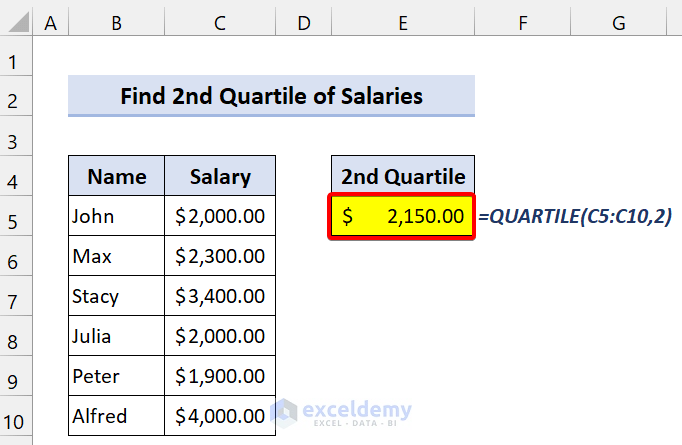
Method 1 – Use the QUARTILE Function to Find Quartiles of Salaries
Steps
- Use the following formula in cell E5:
=QUARTILE(C5:C10,2)- Press Enter.
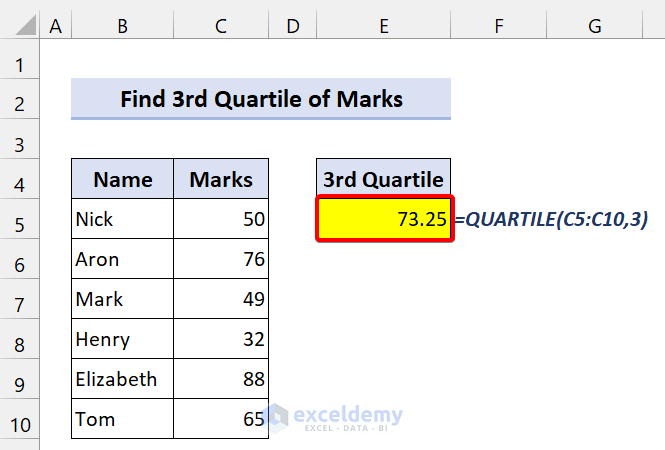
Method 2 – QUARTILE Function to Find Quartiles of Marks in Excel
We have some student marks. Our goal is to find the 3rd quartile of this dataset using the QUARTILE function.
Steps
- Use the following formula in cell E5:
=QUARTILE(C5:C10,3)- Press Enter.
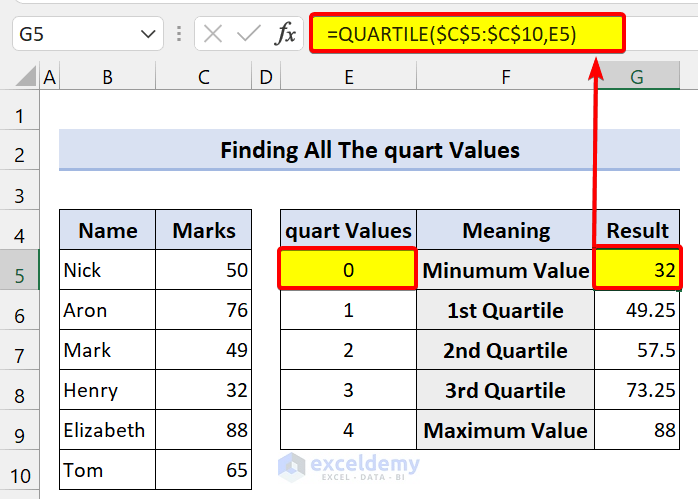
Method 3 – Find Quartiles for All the “Quart” Values
Steps
- Use the following formula in cell G5:
=QUARTILE($C$5:$C$10,E5)The Cell reference in the quart argument.
- Press Enter.
- Drag the Fill handle icon over the range of cells G6:G9.
Method 4 – Examples of QUARTILE.INC and QUARTILE.EXC in Excel
After Excel 2007, Microsoft substituted the QUARTILE function two new variations: QUARTILE.INC and QUARTILE. EXC.
The QUARTILE function still works in Excel, but it might be rendered obsolete and removed in future versions.
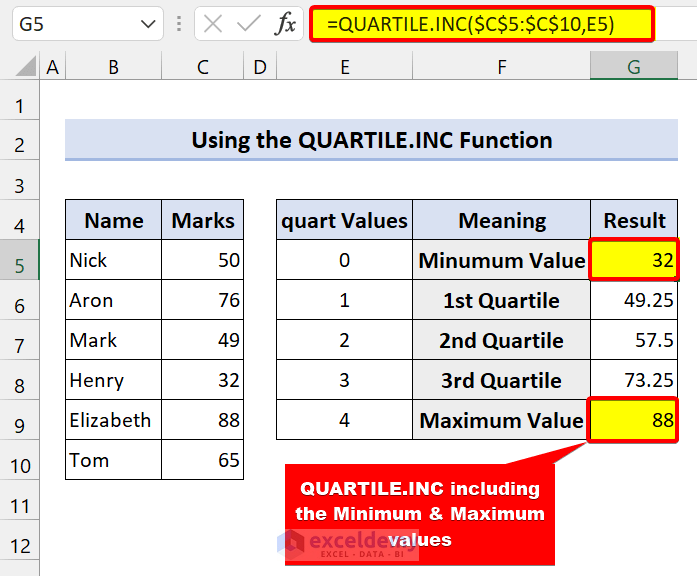
QUARTILE.INC works the same as the QUARTILE function. The “INC” means the function is “inclusive”. This means that QUARTILE.INC contains the minimum and maximum values when computing the quartiles in the data range.
- We are going to use this in the previous dataset. Use the following formula in cell G5:
=QUARTILE.INC($C$5:$C$10,E5)Drag the Fill handle icon over the range of cells G6:G9. It will show the following:
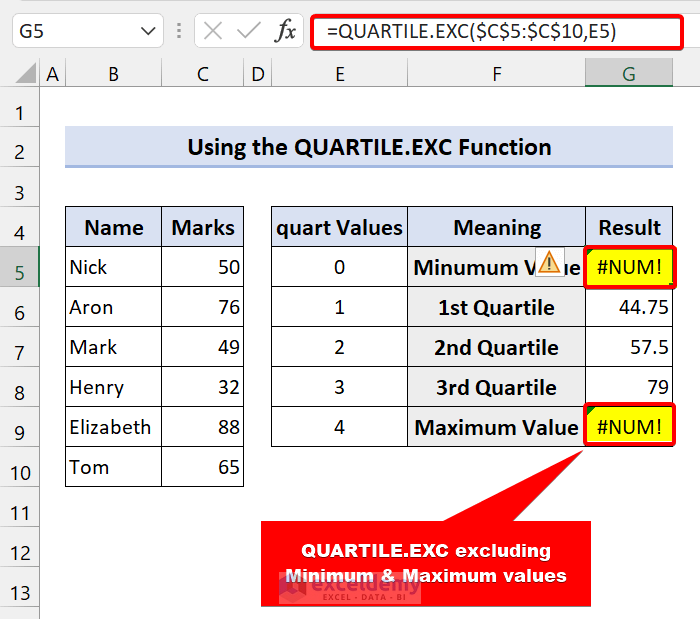
QUARTILE.EXC excludes the minimum and maximum values while calculating the quartiles from the given range.
- Use the following formula in cell G5:
=QUARTILE.EXC($C$5:$C$10,E5)Drag the Fill handle icon over the range of cells G6:G9, it will show the following:
Method 5 – QUARTILE Function in VBA
Steps
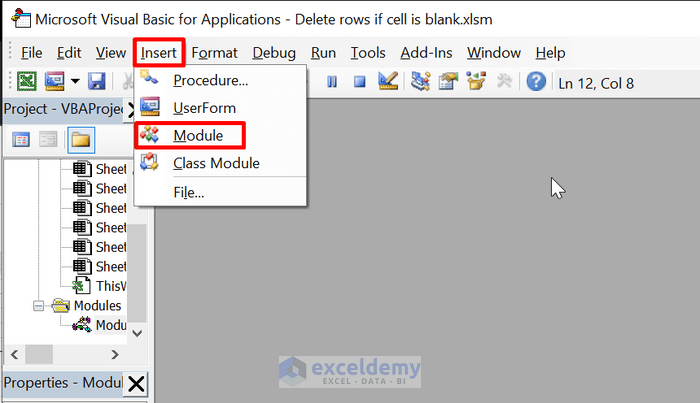
- Press Alt+F11 on your keyboard to open the VBA editor.
- Click on Insert > Module.
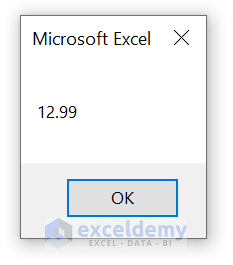
- Insert the following code:
Sub quartile_method()

Dim my_array
Dim wf As WorksheetFunction

my_array = Array(10, 4.7, 13.98, 12, 23.9, 16)
Set wf = Application.WorksheetFunction
MsgBox wf.Quartile(my_array, 2)

End Sub - Save the file.
- Click on Run. It will show you a message box with a result.
Things to Remember
✎ The QUARTILE function divides the dataset into four equivalent parts.
✎ It will show a #NUM! error if the quart value is less than 0 or more than 4.
✎ If your given array is empty, it will also show a #NUM! error.
✎ It will return a #VALUE! error if the given value of quart is non-numeric.
Download the Practice Workbook
<< Go Back to Excel Functions | Learn Excel
Get FREE Advanced Excel Exercises with Solutions!
