Adding data labels to data points of a chart will make it easier to identify a data series in the chart. Data labels are connected to worksheet values by default, and when these values are modified, they adjust automatically. In this article, you will learn what are data labels in Excel and how to add or remove data labels, and several format settings of data labels in a chart.
What Are Data Labels in Excel?
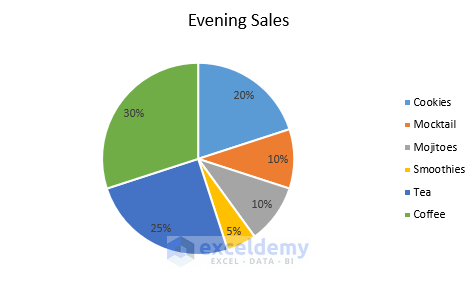
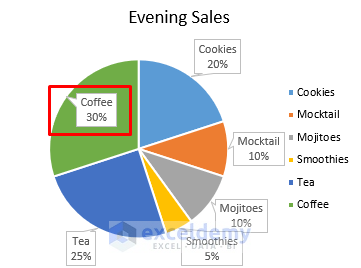
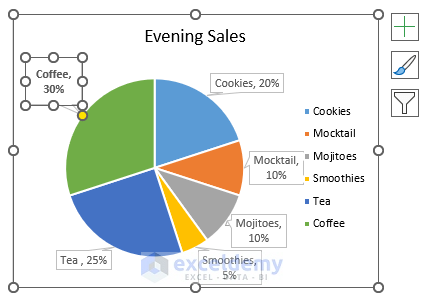
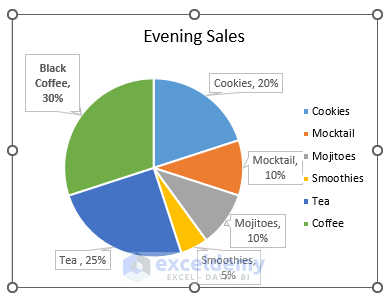
An easier way to understand a chart is through the use of data labels that list details about a series of data or an individual data point. In the following pie chart, for instance, it will be hard to figure out that coffee accounted for 30% of total sales without labels. It is possible to add labels to one series, the entire chart, or a single data point depending on what you’d like to highlight.
How to Add Data Labels to an Excel Chart and Customize Them
i) Add Data Labels
Follow the steps below to add data labels to an Excel chart.
Steps:
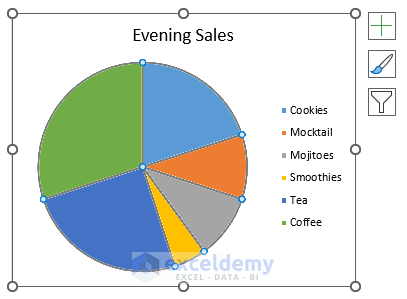
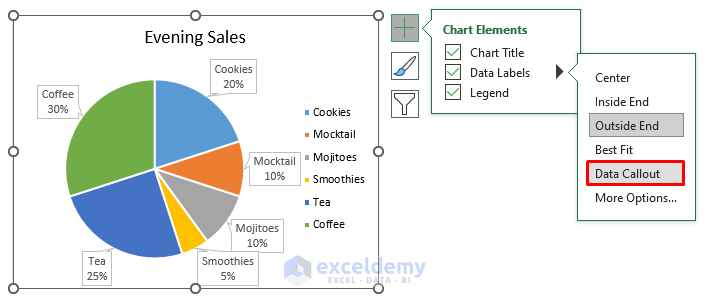
- Please click on the data series or chart you wish to view. If you wish to label a single data point, click it again.
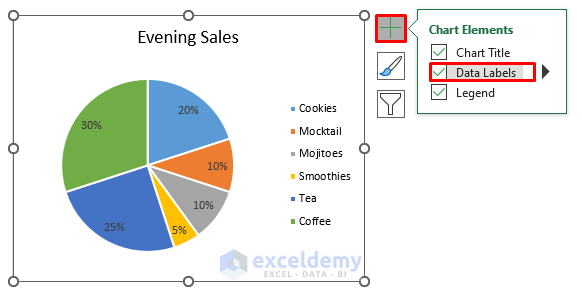
- Select Data Labels from the Add Chart Element menu (+) in the top right corner.
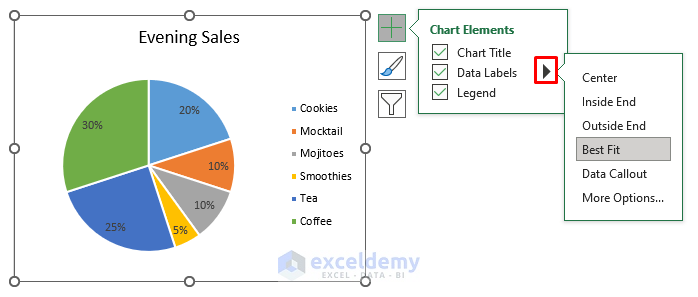
- By clicking the arrow, you can change the position.
- Select Data Callout if you wish to display your data labels inside a text box.
- Data labels can be moved inside or outside of data points to make them easier to read. You can shift a data label by dragging it to the desired location.
- Click the data labels and then press Delete if you think they make your chart too cluttered.

Note: To make the text inside the box easier to read, click and drag them until the desired size is achieved.
Read More: How to Add Data Labels in Excel
ii) Format Data Labels
Customize How Data Labels Look:
In order to modify the appearance of the data labels, just follow the steps below.
Steps:
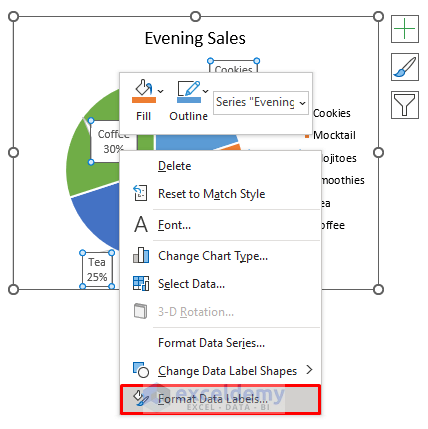
- Simply right-click on the data series/data label you want to see more data and next click on Format Data Labels.
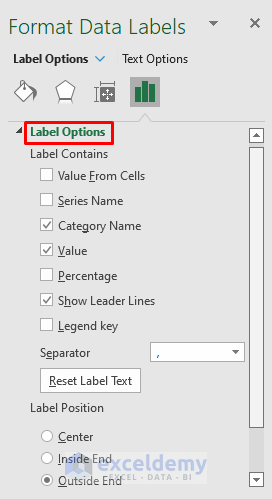
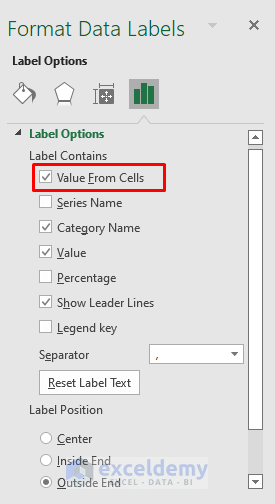
- Then click on the Label Options, and choose the options under Label Contains.
Read More: How to Add Additional Data Labels to Excel Chart
Using Cell Values as Data Labels:
To do so, just follow the steps below.
Steps:
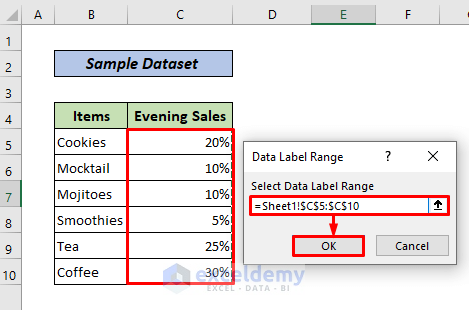
- For more data, right-click the series or label you would like to display, and then click on the Format Data Labels.

- Then, go to the Label Options > Label Contains > Values From Cells.
- Select the cell values you wish to display as data labels from the Data Label Range window appear. As soon as you do that, the Data Label Range window will display the selected range. Once you’ve done that, click OK.
Your chart will now show cell values as data labels.

Read More: How to Show Data Labels in Excel 3D Maps
Changing Data Label Text:
In order to modify the text typed in the data labels, follow the steps below.
Steps:
- Make sure only the data label with the displayed text is selected by clicking it twice.
- Replace the existing text with the new one by selecting it and typing it.
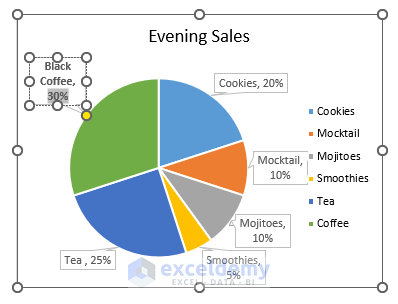
- To exit the data label, click outside of it.
Note: You can use a textbox to add a comment or a single data label to your chart.
READ MORE: How to Edit Data Labels in Excel
Removing Data Labels from an Excel Chart:
To erase data labels from an Excel chart, please follow the steps below.
Steps:
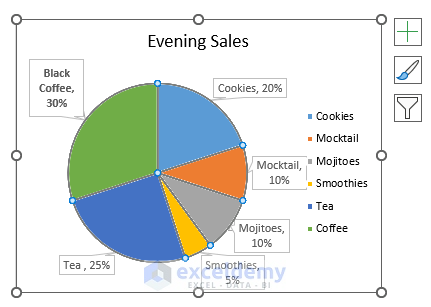
- Simply click on the chart that you would like to remove the data labels from. It shows the Chart Tools, including the Design and also Format tabs.
Now, Perform any of the techniques below to remove data labels from a chart.
- Click on the Add Chart Element under Chart Layouts, select Data Labels, and next choose None.

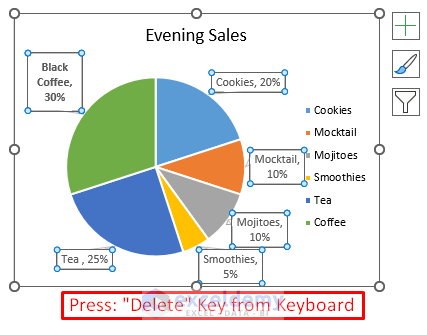
- By clicking the data label once, you can select all data labels, or you can click the label twice to select only one of the data labels you wish to delete, and finally, you can press the DELETE button.
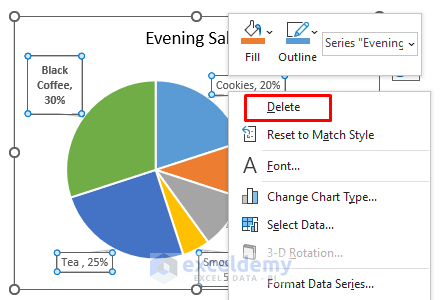
- You can delete data labels by right-clicking them and clicking Delete.
Here is the result for every action above.

- You can also hide the data labels by deselecting the Data Labels box under the Chart Elements.

Read More: How to Format Data Labels in Excel
Download Practice Workbook
You can download the following practice workbook that we have used to prepare this article
Conclusion
In this tutorial, I have discussed what are data labels in Excel and how to add or remove data labels, and several format settings of data labels in a chart. Please, drop comments, suggestions, or queries if you have any in the comment section below.
Related Articles
- [Fixed!] Excel Chart Data Labels Overlap
- How to Add Outside End Data Labels in Excel
- How to Use Millions in Data Labels of Excel Chart
- How to Show Data Labels in Thousands in Excel Chart
- How to Use Conditional Formatting in Data Labels in Excel
<< Go Back To Data Labels in Excel | Excel Chart Elements | Excel Charts | Learn Excel
Get FREE Advanced Excel Exercises with Solutions!
