Create a 3D Map in Excel
Steps:
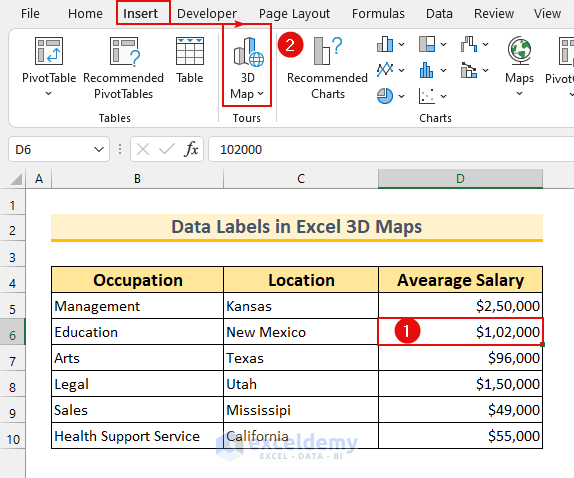
- Select any cell within the dataset. We selected cell D6.
- From the Insert tab >>> select 3D Map.
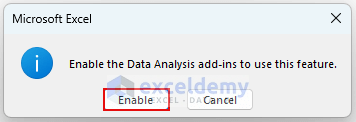
- A dialog box will appear.
- Click Enable.
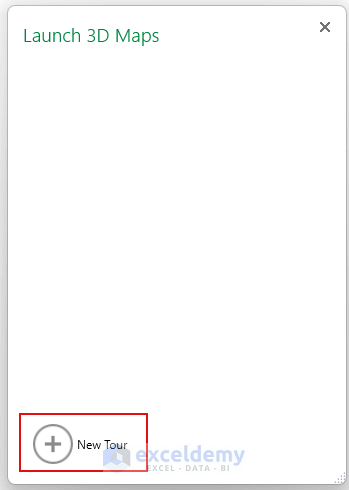
- The “Launch 3D Maps” window will appear.
- Select New Tour.
- Our 3D Map window will appear.
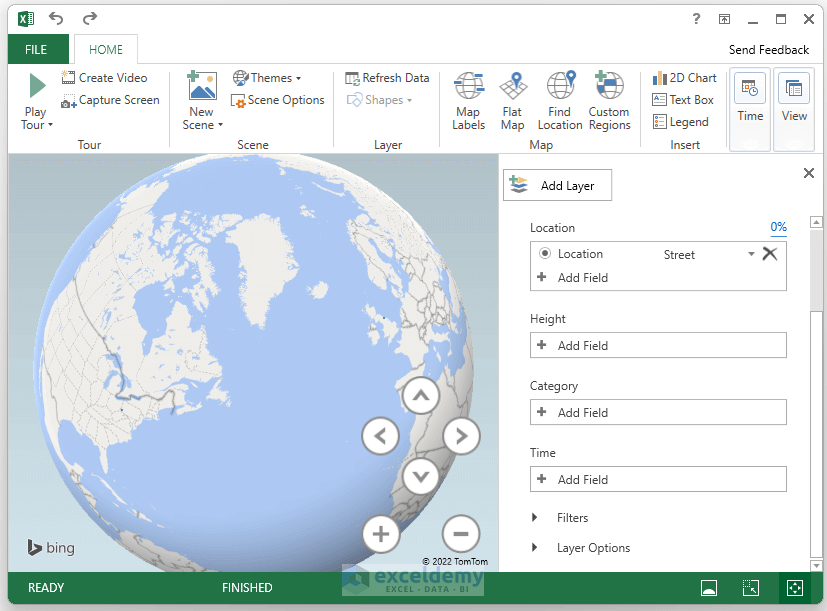
- The “Layer Pane” on the right side of the screen. We will modify our 3D Map settings.
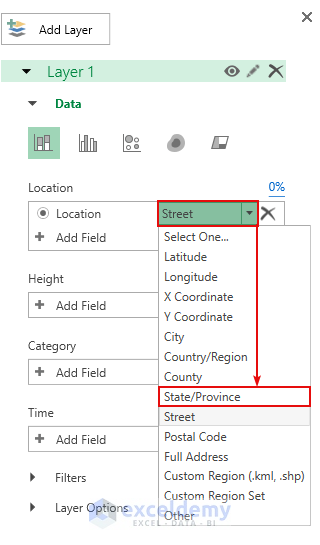
- Change the type of the “Location” column to “State/Province” by clicking on the dropdown list.
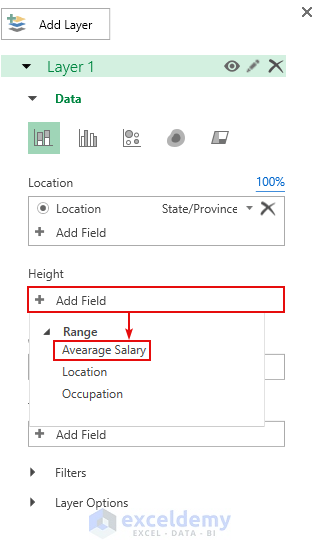
- Select “Average Salary” inside the Height box.
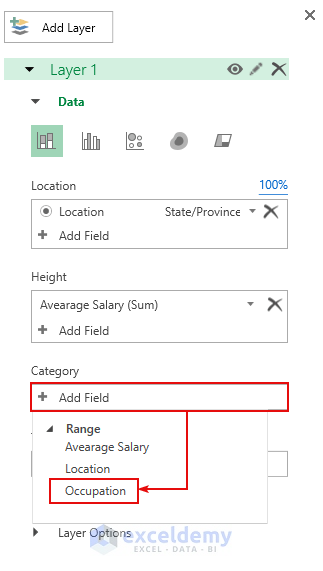
- Select “Occupation” under the Category dropdown list.
- This is what our 3D Map looks like after these steps.

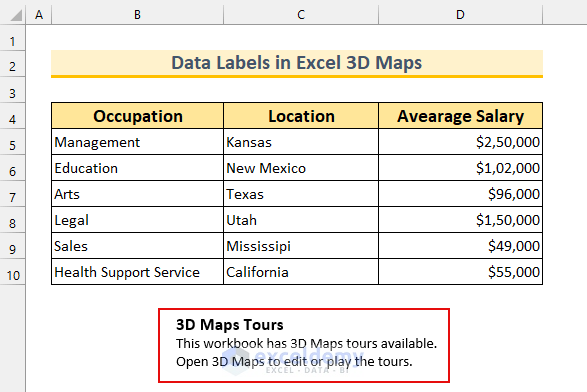
- Our dataset will contain a message of 3D Maps –
“3D Maps Tours.
This workbook has 3D Maps tours available.
Open 3D Maps to edit or play the tours.”
Thus, we can create a 3D Map in Excel.
Method 1 – Adding Annotation to Show Data Labels in Excel 3D Maps
Steps:
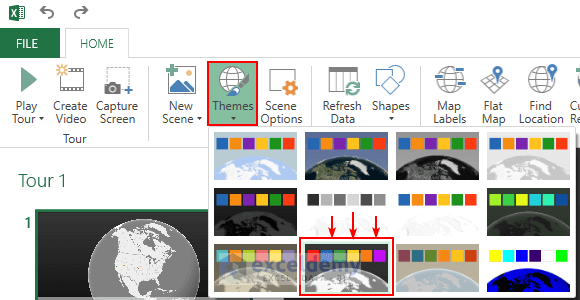
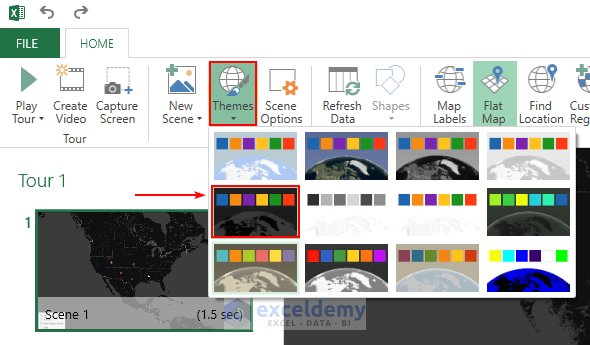
- Change the theme of the Map for better visualization.
- From the Home tab → Themes → select Modern.
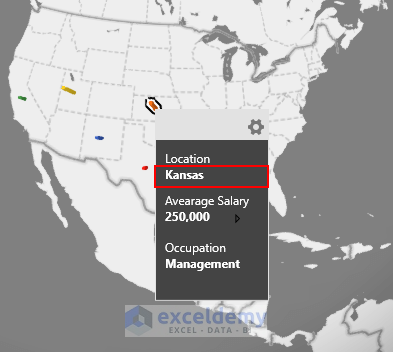
- If we hover over any of the Column Bar then we can see the location Data Label.
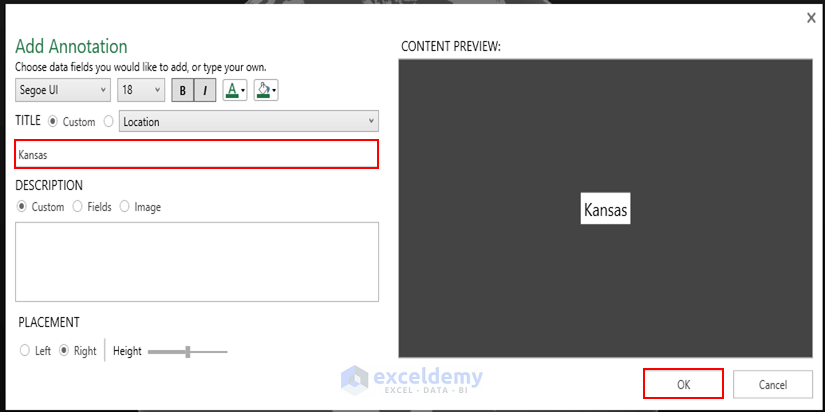
- Right-click on the Column Bar and select Add Annotation.

- A dialog box will appear.
- Type “Kansas” inside the TITLE box and we can see a preview on the right side.
- Press OK.
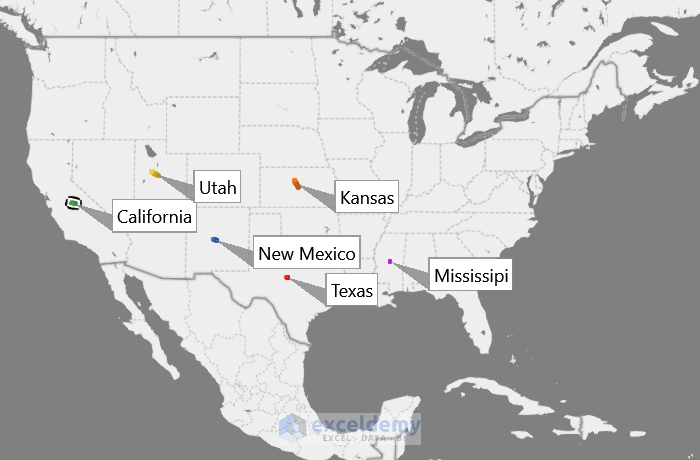
- Create the first Data Label in the 3D Map.
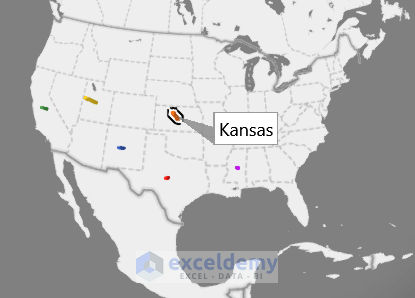
- Repeat for the rest of the data points, and after finishing the 3D Map will look like this.
Method 2 – Enabling Map Labels to Create Data Labels in Excel 3D Maps
Steps:
- We change the theme of the Map for better visualization.
- From the Home tab → Themes → select “Color Black.”
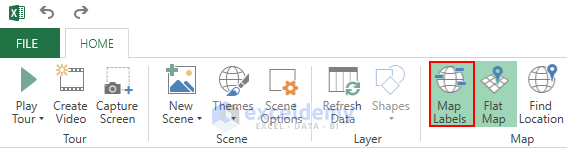
- Enable Map Labels.
- From the Home Tab → select Map Labels.
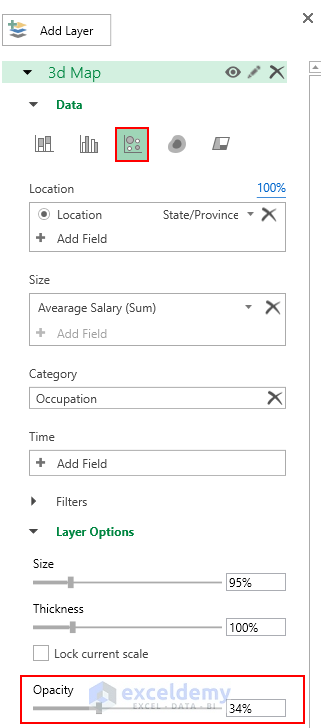
- From the Layer Pane, select Bubble under the Data visualization type.
- Lower the opacity Bubble to make the Map Labels visible.
- The 3D Map will look like this.

Things to Remember
- First, the 3D Map feature is only available on the Windows platform and from Excel 2013. Therefore, the earlier versions will not have access to this feature, and you cannot use this feature on Apple’s OS.
- Next, it was known as Power Map in Excel 2013. Later, Microsoft renamed it 3D Map.
- Lastly, if we create a 3D Map in Excel 2016, it will not be compatible with Excel 2013.
Download Practice Workbook
Related Articles
- How to Add Outside End Data Labels in Excel
- How to Use Millions in Data Labels of Excel Chart
- How to Show Data Labels in Thousands in Excel Chart
- How to Use Conditional Formatting in Data Labels in Excel
- [Fixed!] Excel Chart Data Labels Overlap
<< Go Back To Data Labels in Excel | Excel Chart Elements | Excel Charts | Learn Excel

