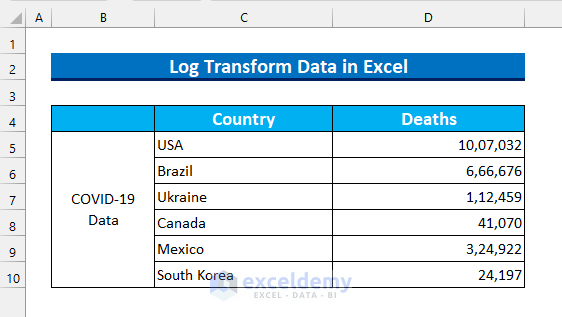
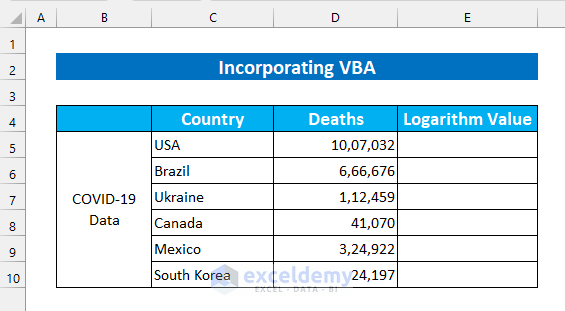
The dataset below showcases the number of deaths up to June 1st, 2022 in 6 different countries.
What Is Log Transform?
Log Transform transforms a skewed data distribution to conform normality.
The Logarithm is: p = Logq(r),
It also can be written as, qp = r.
The base is q, which can be any positive number (except 1).
10 is the most common base, but the base selection depends on the statistical model of the research.
Read More: How to Plot Log Scale in Excel
Method 1 – Using the LOG10 Function to Transform Data in Excel
Steps:
- Select E5:E10.
- Enter the following formula.
=LOG10(D5)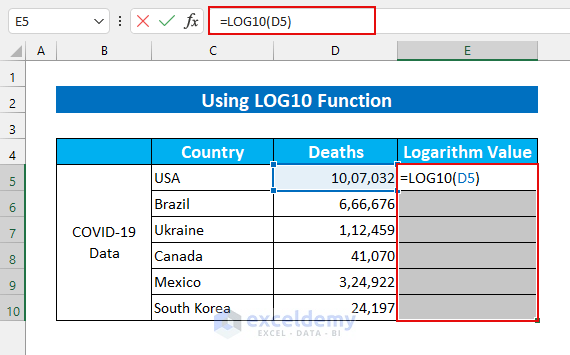
- Press CTRL + ENTER.
This will AutoFill the formula.
Data is transformed from normal scale to Log scale.
![]()
Read More: Excel Logarithmic Scale Start at 0
Method 2 – Log Transform Data in Excel Applying the LOG Function
Steps:
- Select E5:E10.
- Enter the following formula.
=LOG(D5)
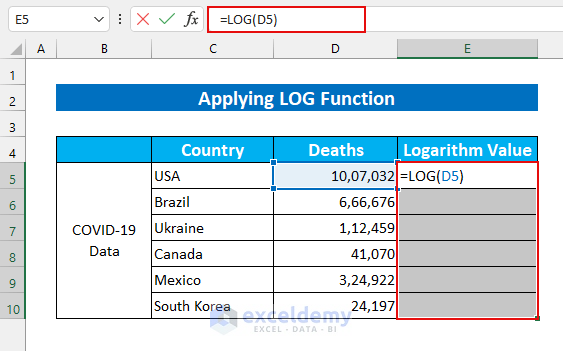
- Press CTRL + ENTER.
This is the output.
![]()
Similar Readings
- How to Calculate Log in Excel
- How to Calculate Antilog in Excel
- How to Do Inverse Log in Excel
- How to Plot Log Log Graph in Excel
Method 3 – Using the LOG Function with Base 5 to Transform Data
Steps:
- Select E5:E10.
- Enter the following formula.
=LOG(D5,5)
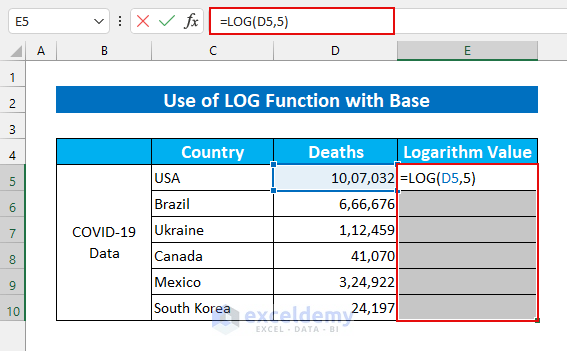
- Press CTRL + ENTER.
This is the output.
![]()
Read More: How to Calculate Logarithmic Growth in Excel
Method 4 – Log Transform Data in Excel using VBA
Steps:
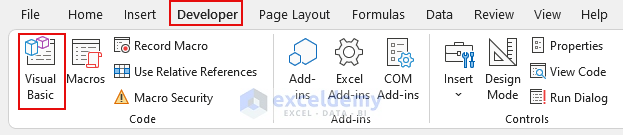
- In the Developer tab >>> select Visual Basic (You can also press ALT + F11).
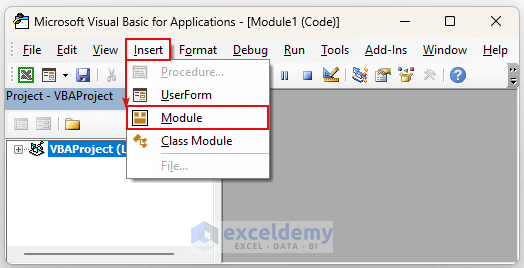
- In Insert, select Module.
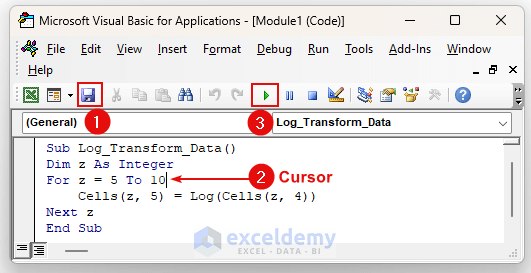
- Enter the following code in the Module.
Sub Log_Transform_Data()
Dim z As Integer
For z = 5 To 10
    Cells(z, 5) = Log(Cells(z, 4))
Next z
End Sub
![]()
VBA Code Breakdown
- The Log_Transform_Data Sub Procedure is called.
- The variable type is defined.
- The For Next Loop goes through the data. 5 is provided as the starting value (data starts in row 5).
- The Cells property is used to enter values.
- The VBA Log function is used, and the Cells property goes through our cell values.
- Save the Module.
- Click inside the code.
- Click Run.
This is the output.
![]()
Things to Remember
- Do not provide numerical values in the LOG function (the “#Value!” error is displayed).
- If the base is 0 or a negative number, the “#Num!” error is displayed.
- If the base is 1, the “#DIV/0!” error is displayed.
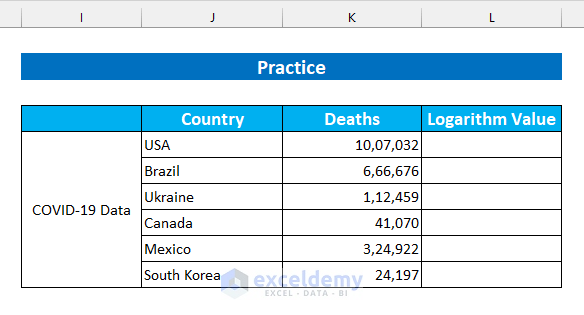
Practice Section
Practice here.
Download Practice Workbook
Related Articles
- How to Calculate Log Base 2 in Excel
- How to Calculate Natural Logarithm in Excel
- How to Take Log of Negative Numbers in Excel
<< Go Back to Excel LOG Function | Excel Functions | Learn Excel
Get FREE Advanced Excel Exercises with Solutions!
