Introduction to Treemap Chart
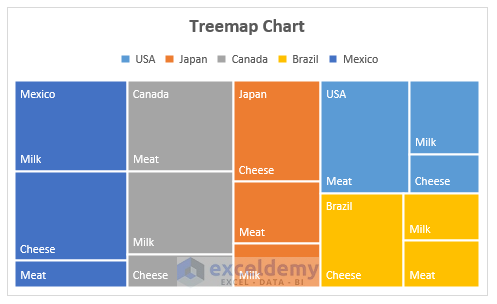
A Treemap chart represents hierarchical data as nested rectangles, with size and color indicating attributes providing a compact view of data structure and relationships.
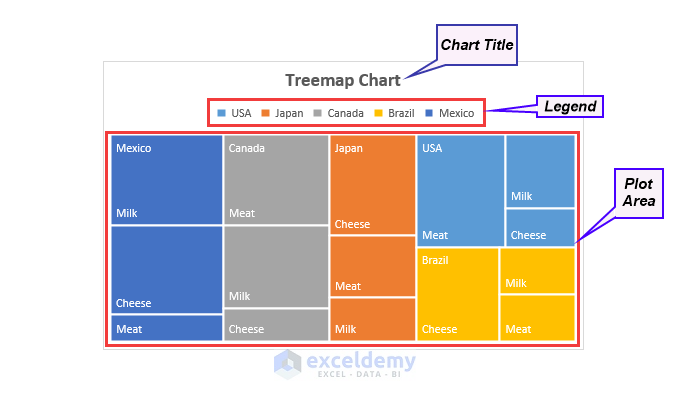
There are three main sections of a Treemap chart. These are:
- Plot Area: The plot area is the region within a chart where the actual graphical representation of data occurs, including the bars, lines or other elements. It defines the space where the data is visually displayed.
- Chart Title: The chart title is a text label that provides a clear and concise description of the chart’s purpose or subject matter. It usually appears at the top of the chart and helps viewers understand the context or topic being depicted.
- Legend: The legend is a visual guide accompanying the chart that explains the meaning of different colors, symbols or patterns used in the chart. It provides a key to understanding the data representation and helps viewers interpret the chart accurately.
Download Practice Workbook
How to Create a Treemap Chart in Excel
- Select the data which you want to represent in the chart.
- Click on the Insert tab from the menu bar and choose Treemap.
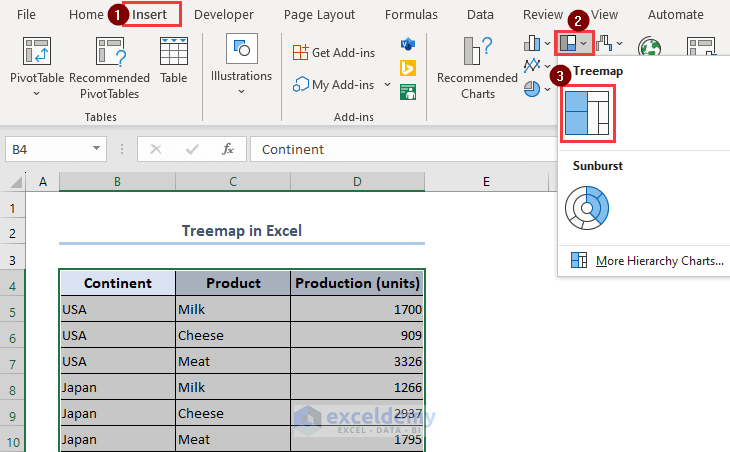
- You can also select the option Recommended Charts.
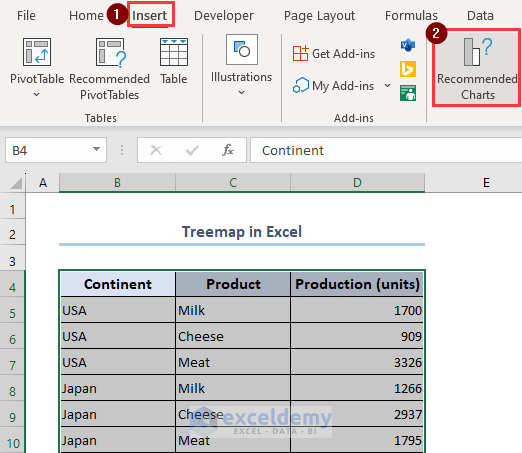
- From All Charts, select the Treemap option.
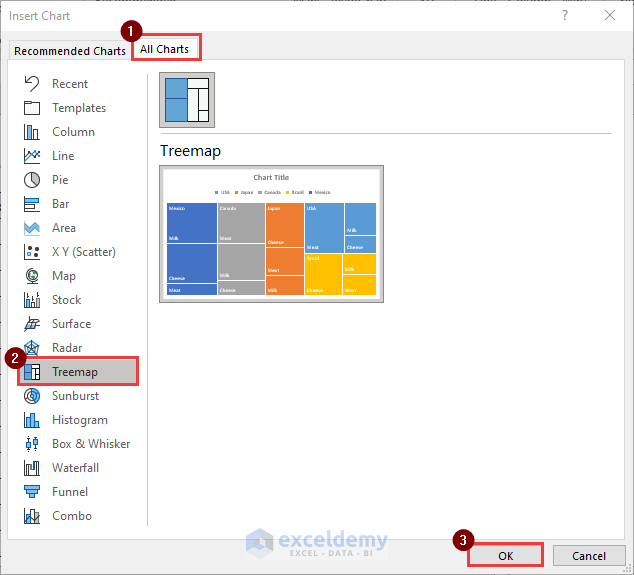
- You will get a Treemap chart of the data.
How to Modify/Customize Treemap in Excel
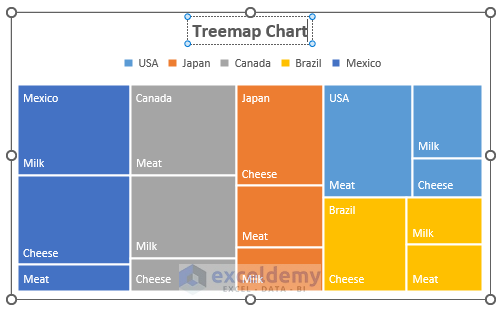
Method 1 – Add or Change Chart Title
- Double-click on the Chart Title and you will see a typing cursor.
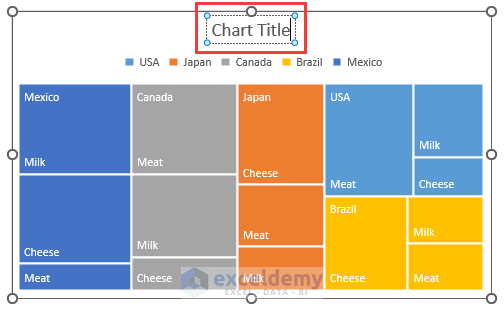
- Enter the new title. You can also format that in bold letters.
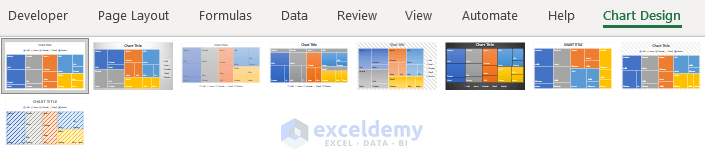
Method 2 – Customize Layout and Styles
- You can customize your Treemap chart in different layouts and styles. Click on the chart, and it will show different styles in the ribbon under Chart Design.
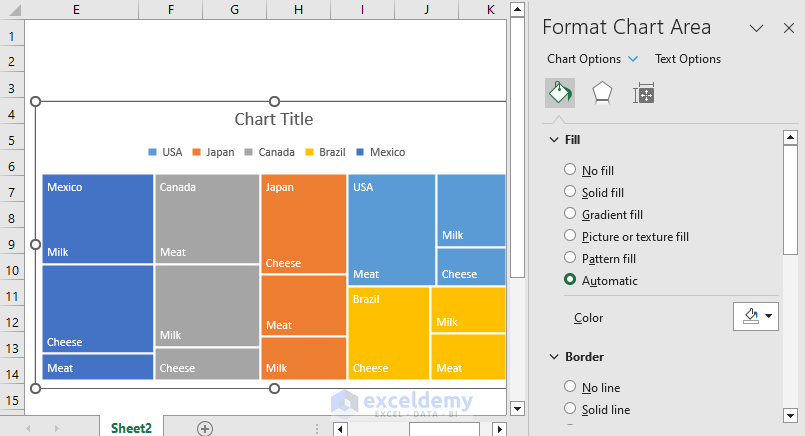
Method 3 – Formatting Chart
- You can format the treemap chart by using the Context Menu. JRight-click on the mouse and you will get the Format Chart Area option.
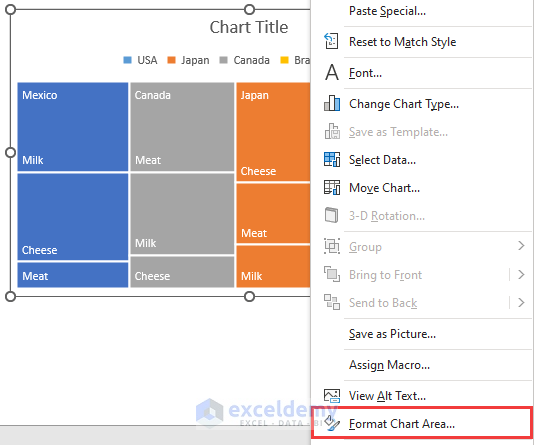
- You can also double-click on the chart to get the Format Chart Area window on the right side of your Excel.
Read More: How to Add and Format Data Labels in Excel Treemap
Method 4 – Resize Chart
- Place the cursor to a corner or edge of the chart, you will see an arrow sign. Move the cursor to resize the chart.
Pros and Cons of Treemap Chart
Pros:
- Treemap charts efficiently utilize space by representing data hierarchies in a compact and organized manner.
- Treemap can effectively display hierarchical relationships within the data.
- Treemap can reveal visual patterns and trends in the data.
Cons:
- There is a practical limit to the number of data elements that can be displayed effectively.
- While Treemap charts provide a relative size comparison of data elements, they may not accurately represent precise values.
- If the Treemap chart contains too much data or multiple levels of hierarchy, it can overwhelm users with excessive information.
Things to Remember
- Ensure your data has a logical hierarchical structure, with values that can be accurately represented by the size of the rectangles.
- Excessive levels of hierarchy can clutter the Treemap and make it challenging to interpret. Focus on the most important levels to maintain clarity.
- Use consistent color schemes and size scaling across the Treemap to ensure accurate comparisons between categories.
Frequently Asked Questions
1. Can I export a Treemap chart from Excel to other applications or formats?
Yes, you can export Treemap charts from Excel to other applications or formats. Excel provides various export options, such as saving the chart as an image file (e.g., JPEG, PNG), copying and pasting the chart into other programs, or embedding the chart in documents (e.g., Word, PowerPoint). You can also save the entire Excel file containing the Treemap chart and share it with others who have Excel installed.
2. Can I create a dynamic or interactive Treemap chart in Excel?
While Excel’s native Treemap chart does not offer dynamic or interactive features, you can create a dynamic effect by using features like data validation, cell references, or macros. These techniques allow you to change the chart’s underlying data dynamically, enabling interactive behavior based on user inputs or changes.
Treemap Chart Excel: Knowledge Hub
- How to Create a Treemap with Multiple Levels In Excel
- Create Treemap Chart to Show Values in Excel
- How to Change Treemap Order in Excel
- How to Create Hierarchy Tree from Data in Excel
<< Go Back to Excel Charts | Learn Excel
Get FREE Advanced Excel Exercises with Solutions!
