In this article, we will create a hierarchy tree of the following organization using different techniques.

Method 1 – Using SmartArt Tool
Steps:
- Go to Insert >> Illustrations >> SmartArt.
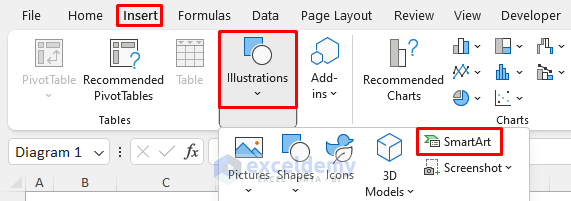
The SmartArt Graphic window will open.
- Select Hierarchy and choose a template. Here, we’ll use the Labeled Hierarchy option.
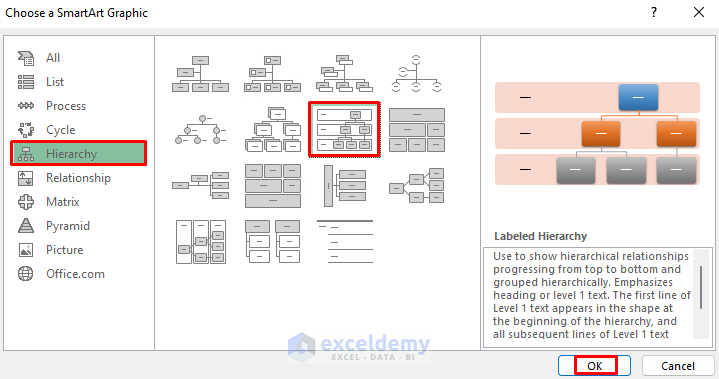
The Hierarchy template will appear.

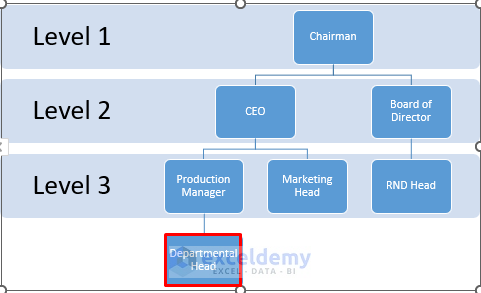
- Fill the blank parts with the designations in our dataset above, organized into Level 1, Level 2, and so on.
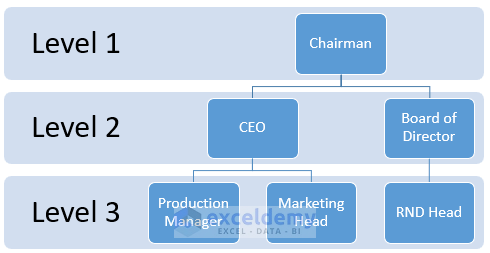
We can see that the Hierarchy template doesn’t have enough Levels or boxes to represent all the designations.
Let’s add a Level/Box for the Departmental Head, who reports to the Production Manager.
- Select the Production Manager box.
- Go to SmartArt Design >> Add Shape >> Add Shape Below.
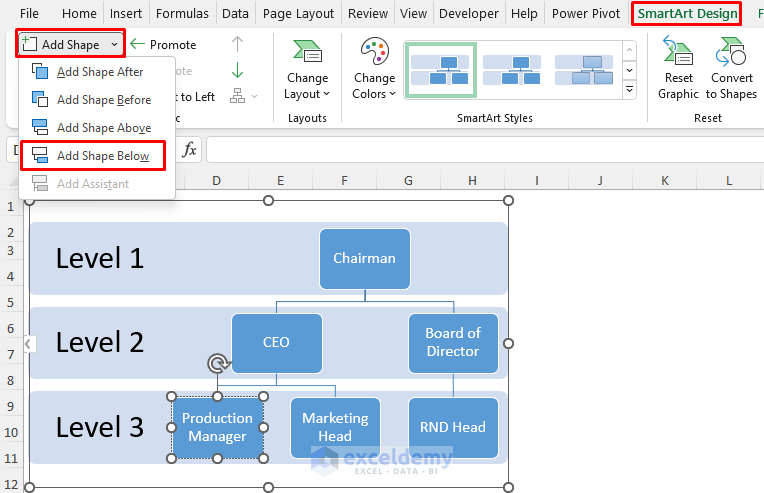
A box will be created under the Production Manager.
- Fill it with the appropriate designation.
- Similarly, Add Shapes below the RND Head and fill them with Departmental Head 1 and 2, as there are two Departmental Heads under the RND Head in our structure.

- Add the Executives using the same procedure.

- To add the row labels for new Levels below, select any of the Levels and copy it by pressing CTRL+C.

- In the newly added rows, press CTRL+V twice to paste the labels.

- Edit the labels to show the correct text.

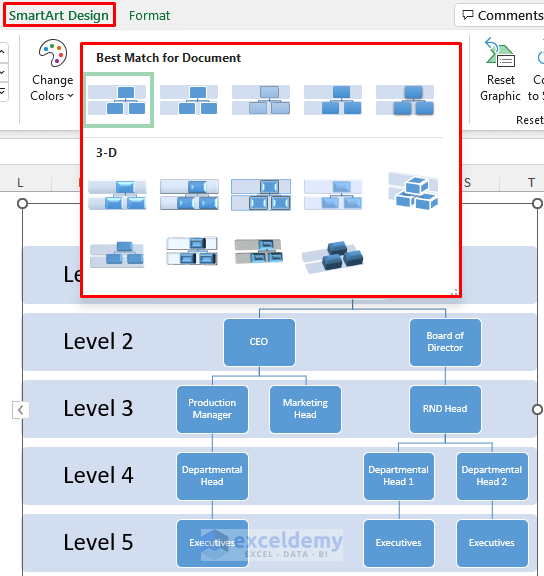
Change the design of your hierarchy tree by selecting a different option from the SmartArt Design group.
Read More: How to Create a Treemap with Multiple Levels In Excel
Method 2 – Applying Power Pivot
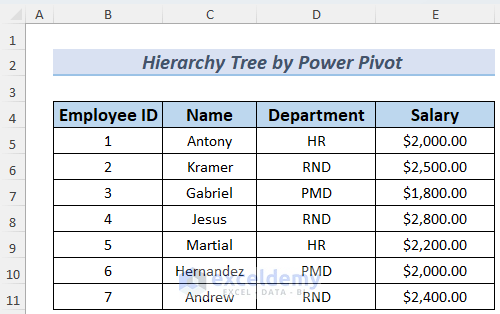
This method is useful when we want to make a hierarchy tree using an Excel Dataset.
Suppose we want to make a hierarchy tree based on the department of an organization. The dataset is as follows:
Steps:
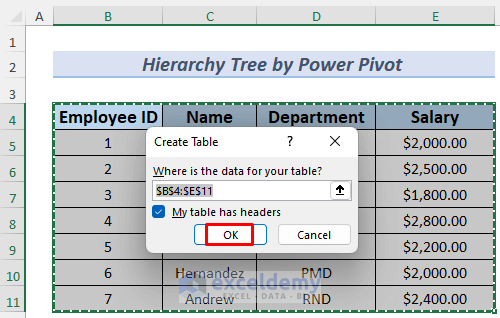
- Convert the data range to a table by selecting it and pressing CTRL+T.
- Select My table has headers.
- Click OK.
- Go to Power Pivot >> Manage.
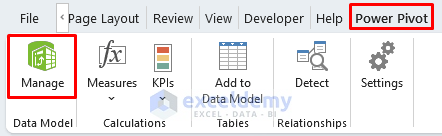
This command will open the Power Pivot window.
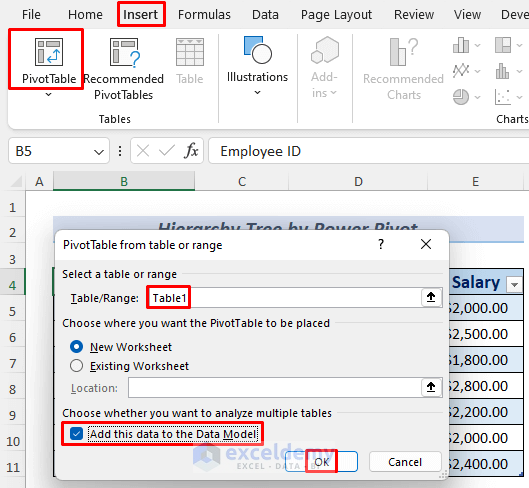
- Go back to the table and select Insert >> PivotTable.
- Insert the Table/Range (Table1).
- Tick Add this data to the Data Model.
- Click OK.
The command will create a new sheet to store the PivotTable, and add the table to the Power Pivot window.
- Select Home >> Diagram View.
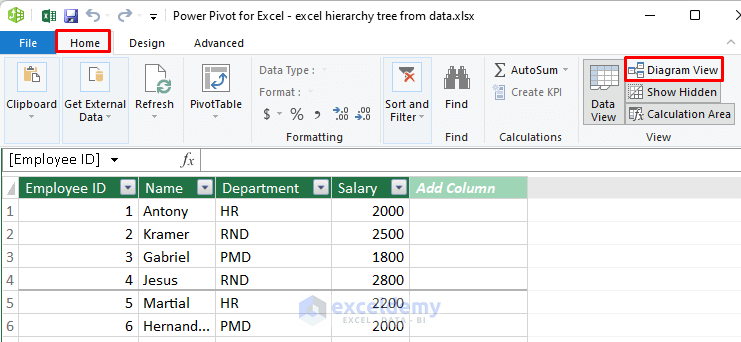
The Diagram View will appear. We are creating the hierarchy tree based on the Department and Employee Names, so selecting the Table Headers in order is necessary.
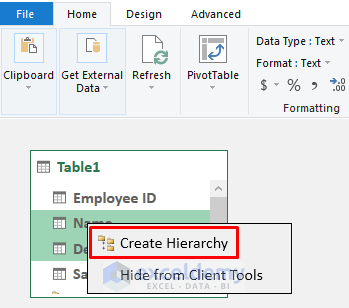
- Hold down the CTRL key and select Department and Name.
- Select Create Hierarchy. You can name it if you want.
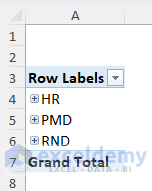
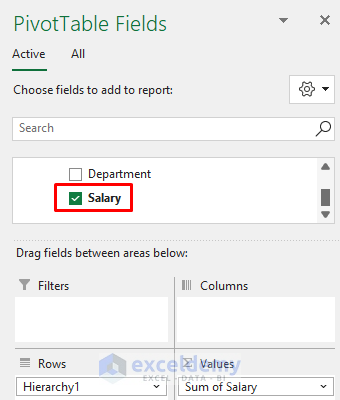
- Go back to the Pivot Table sheet and you will find the Hierarchy tree (Hierarchy1) in the PivotTable Fields.
- Tick it.

The hierarchy will appear in the PivotTable showing the Department Names.
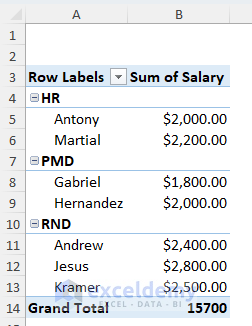
- Add other PivotTable Fields to have a more detailed view of the hierarchy.
- Click on the Plus Icons beside the Department Names to unhide the Employee Names with their Salaries.
Method 3 – Using Charts to Create a Hierarchy Treemap
Now let’s create a treemap in Excel using hierarchy data. The dataset we’ll use here contains some football Clubs’ names, their Region and Countries, plus their Net Worth in Million Dollars.
Steps:
- Select the entire dataset (B4:E13).
- Go to Insert >> Chart >> Treemap.
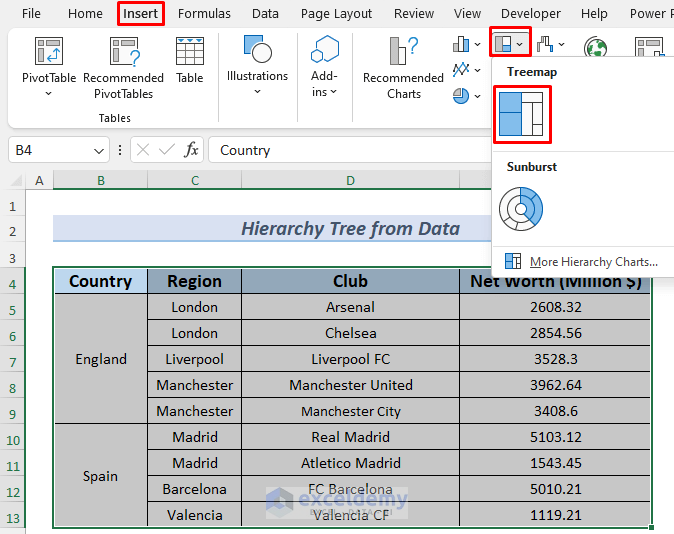
A treemap will be created, wherein the clubs are grouped by country, and each club fills an area in the chart proportionate to its Net Worth.

Read More: Create Treemap Chart to Show Values in Excel
Download Practice Workbook
Related Articles
<< Go Back to Treemap Chart Excel | Excel Charts | Learn Excel
Get FREE Advanced Excel Exercises with Solutions!
