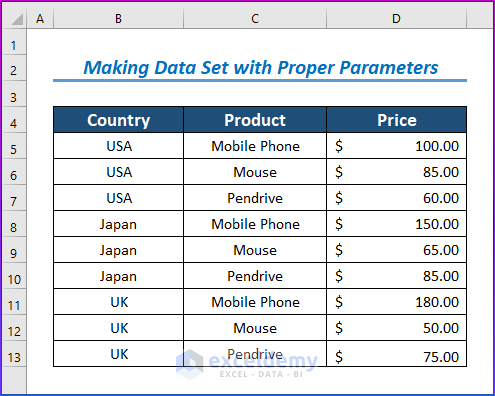
Step 1 – Making a Data Set with Proper Parameters
- Create a dataset and insert the values.
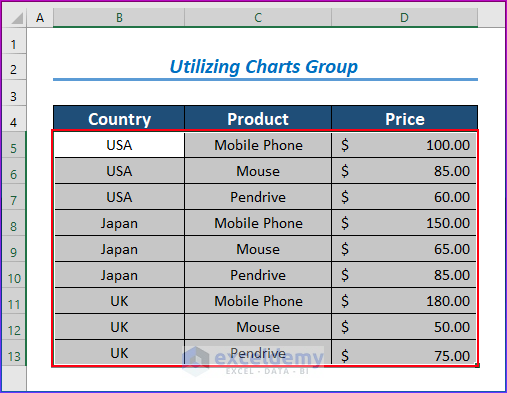
Step 2 – Insert a Treemap Chart
- Select the entire data set or the portion you want to chart.
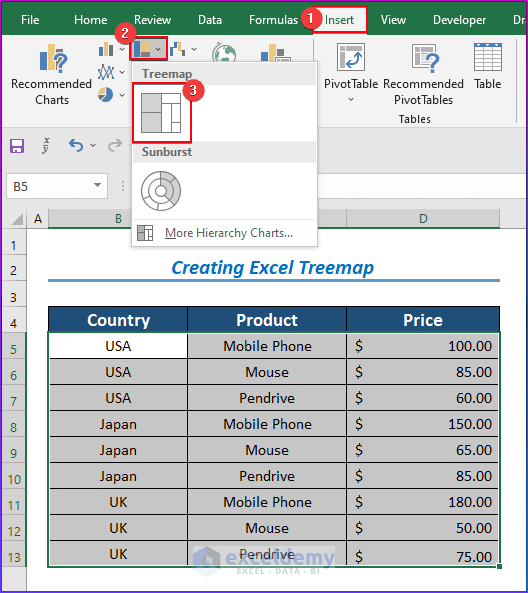
- Go to the Insert tab.
- Choose the Insert Hierarchy Chart from the Charts group.
- Select the Treemap chart.
Read More: How to Create Hierarchy Tree from Data in Excel
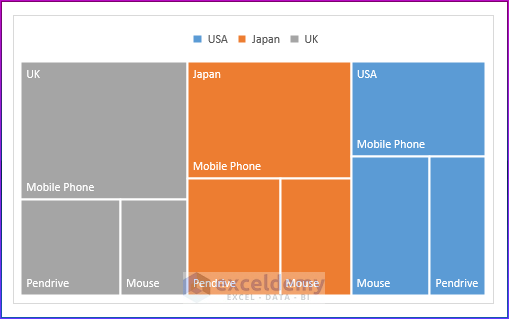
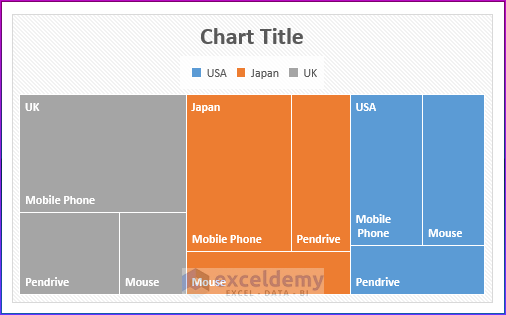
Step 3 – Creating the Treemap Chart
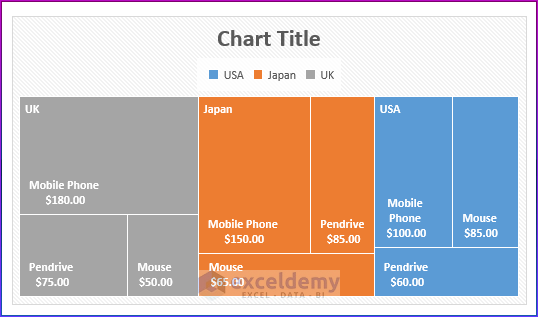
A treemap diagram illustrates how data is distributed among various segments and subsegments. Larger rectangles with different colors serve as representations of the data set’s top categories. Small rectangles represent the data’s subcategories. The contribution of the larger rectangle is indicated by its size.
- Here’s a sample treemap chart from the sample dataset.
Read More: How to Create a Treemap with Multiple Levels In Excel
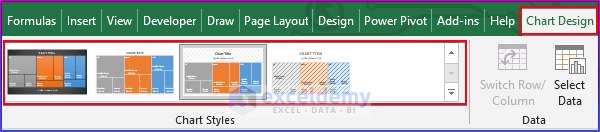
Step 4 – Change the Treemap Order in Excel
- Right-click on the treemap chart.
- You will see the various treemap chart orders in the Chart Design tab.
- Select any design for changing the treemap order.
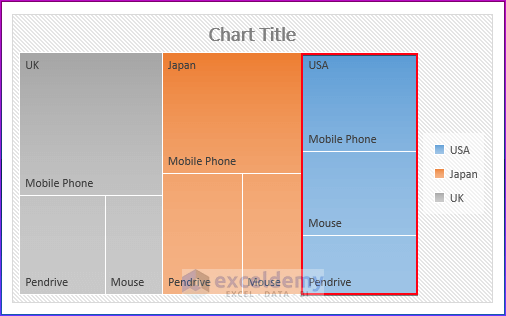
- You will see that the mobile phone and Pendrive are in the upper section and the mouse is in the lower section.
- The new order differs from the previous one.
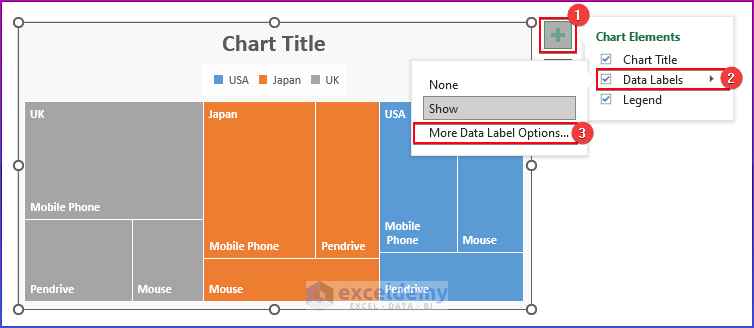
Step 5 – Using Data Labels to Edit a Treemap Chart in Excel
- Click on the treemap chart.
- Choose Date Labels from the Chart Elements option.
- Select the More Data Labels Options…
- The Format Data Labels window will open.
- To show all the prices for all the respective products, select the Value option from the Label Options.
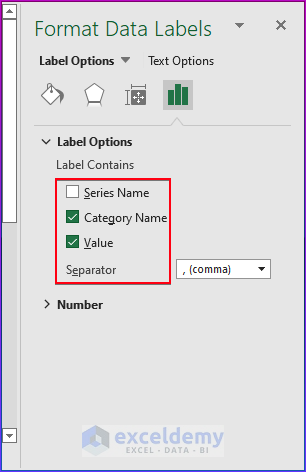
- You will find all the values for all the respective categories.
Download the Practice Workbook
Related Articles
<< Go Back to Treemap Chart Excel | Excel Charts | Learn Excel
Get FREE Advanced Excel Exercises with Solutions!
