In this tutorial, I am going to show you the step-by-step procedures on how to create a treemap with multiple levels in Excel. You can use these steps for any type of dataset to generate visually attractive treemaps. Throughout this tutorial, you will also learn some important Excel tools and techniques that will be very useful in any Excel-related task.
What Is a Treemap?
The Treemap in Excel is a common type of chart that provides a hierarchical representation of the data. This type of chart uses rectangular boxes which serve as branches to represent data within groups. The relationship that exists between the data is actually a one-to-many relation. This type of chart is very useful to compare products and depict the best-selling ones. A treemap consists of 3 major sections.
- Plot Area: This is the portion where we generate the visual representation of the data. Each rectangle has a label marking the name of the group.
- Chart Title: Here you can give a descriptive name to the chart and place it in a suitable location.
- Legend: This section denotes the color of each data category to make it easy to compare them.
Treemap with Multiple Levels In Excel: Step-by-Step Procedures to Create
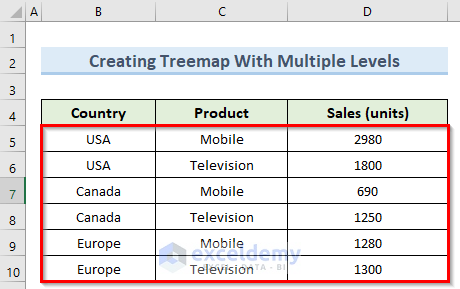
We have taken a concise dataset to explain the steps clearly. The dataset has approximately 7 rows and 3 columns. Initially, we are keeping all the cells in General format. For all the datasets, we have 3 unique columns which are Country, Product, and Sales (units). Although we may vary the number of columns later on if that is needed.
Step 1: Creating Dataset for Treemap
In this first step, we will prepare the data table necessary to create the treemap chart in Excel. Follow the steps below to do this.
- First, enter the necessary data headings in cells B4, C4, and D4 as in the image below.
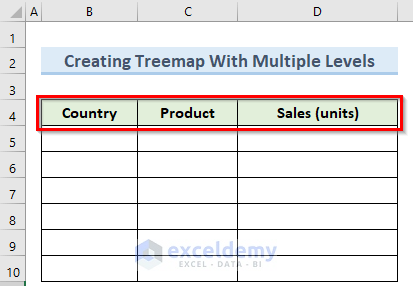
- Next, insert the data values under the respective columns.
Read More: Create Treemap Chart to Show Values in Excel
Step 2: Inserting Chart
After we have created the data table, we need to go through the steps to generate the treemap chart with the multiple levels of data groups. Follow the steps below to achieve this.
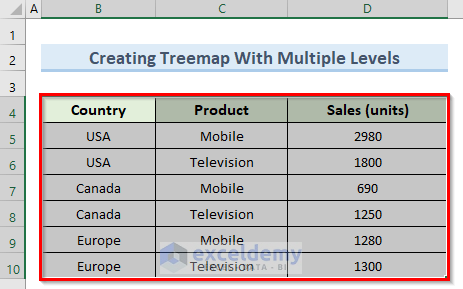
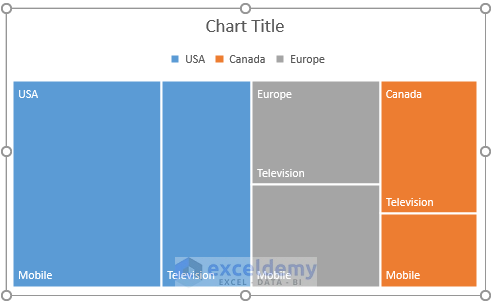
- To begin this step, select the cells from B4 to D10.
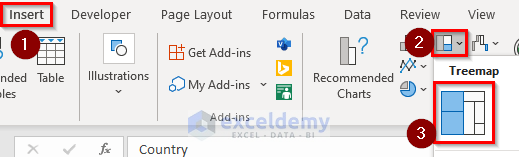
- Next, go to the Insert tab and click on Insert Hierarchy Chart.
- Here, select Treemap.
- As a result, this will insert the initial treemap with multiple levels as in the image below.
Read More: How to Create Hierarchy Tree from Data in Excel
Step 3: Formatting Treemap Chart
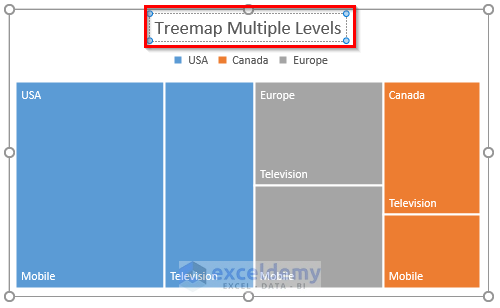
Once we have the treemap, let us now go on and format that to make it more visually presentable.
- To start with formatting, click on the chart title and type Treemap Multiple Levels.
- Then, click on the “+” icon with Chart Elements beside the chart and select Legend.
- Next, select the Bottom option to align the legend at the bottom.
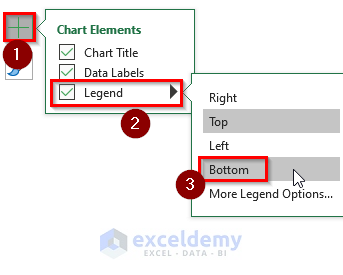
- Immediately, the country indicating legends will move to the location we specified.

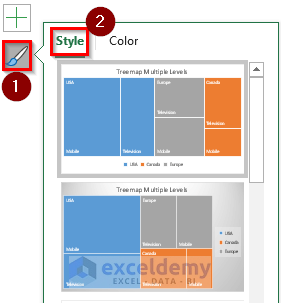
- After that, click on the Chart Styles icon and select Style.
- Here, you can choose any style for the treemap chart.
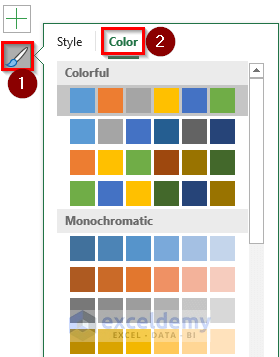
- Next, click on the Color option which will give you multiple color palettes for the treemap chart.
Read More: How to Add and Format Data Labels in Excel Treemap
When to Use Excel Treemaps?
- If you want to depict a part-to-whole relation between the categories.
- When the exact comparison between the data groups is not very important.
- In situations where the dataset has a hierarchical order.
- The audience of the chart doesn’t have any color sensitivity problems.
Download Practice Workbook
You can download the practice workbook from here.
Conclusion
I hope that you were able to apply the methods that I showed in this tutorial on how to create a treemap with multiple levels in Excel. As you can see, it involves quite a few steps to achieve this. So carefully follow these while applying them to your own dataset. If you get stuck in any of the steps, I recommend going through them a few times to clear up any confusion. If you have any queries, please let me know in the comments.
Related Article
<< Go Back to Treemap Chart Excel | Excel Charts | Learn Excel
Get FREE Advanced Excel Exercises with Solutions!
