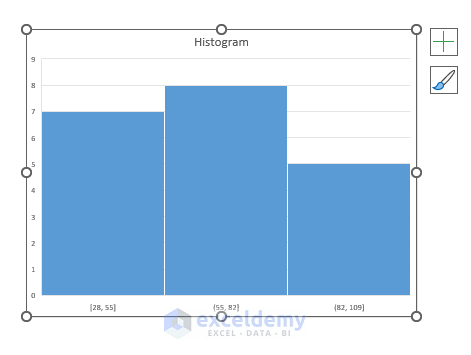
Here’s an overview of a histogram created by applying bin ranges.
Method 1 – Using the Built-in Histogram Chart Option (For Excel 2016 and Later Versions)
Steps:
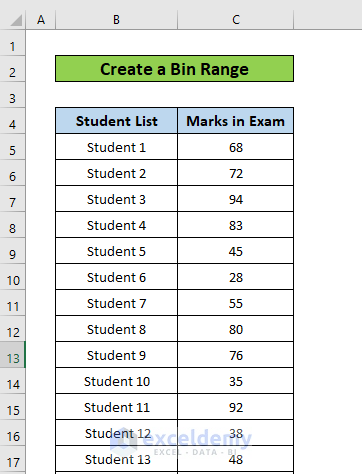
- Create the worksheet. In our case, we put the exam marks of 20 students ranging from 10 to 100.
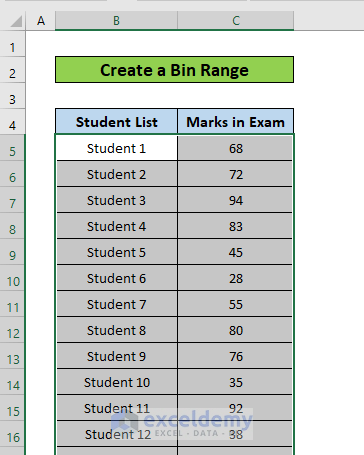
- Select the whole data range.
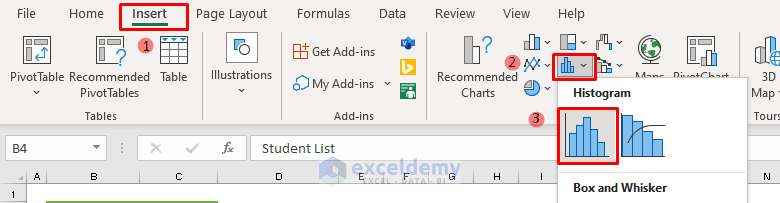
- Go to the Insert tab and select Histogram from the options.
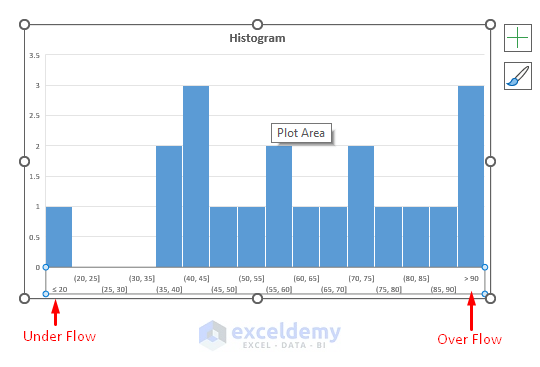
- Here’s the stock histogram.
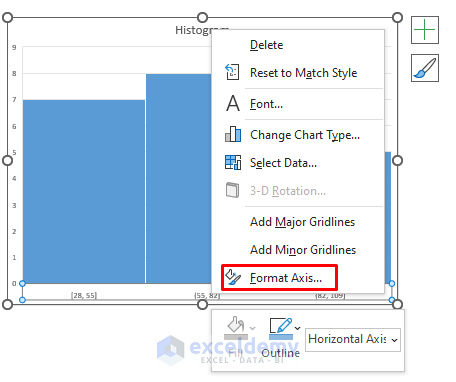
- Right-click on the horizontal axis and select Format Axis.
- Change the Bin width as needed. We chose 5 as Bin width.
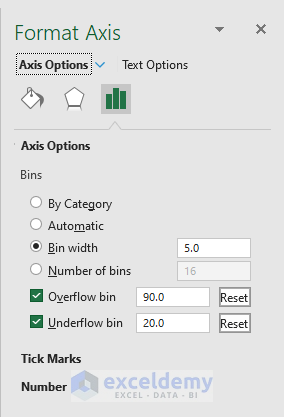
- Check the Overflow bin and Underflow bin and insert the values which the histogram will plot.

- To add labels to the histogram, right-click on it and select Add Data Labels.
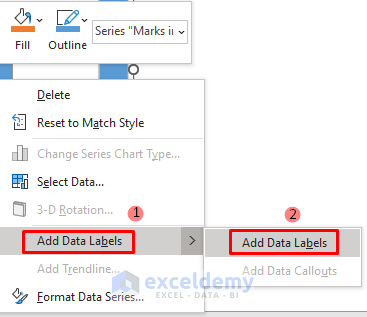
- The frequency of each bin will be displayed on top of the bar.

Read More: How to Create a Histogram in Excel with Bins
Method 2 – Using the Data Analysis Toolpak
Part 1 – Download the Data Analysis Toolpak
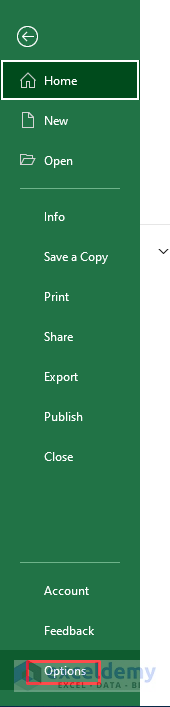
- From File, select Options.
- The Options window will pop up.
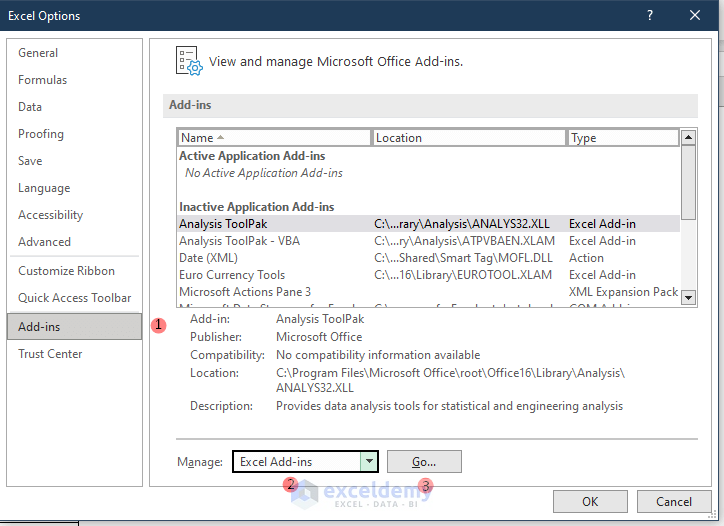
- Select Add-ins.
- Choose Excel Add-ins in the Manage field and click on Go.
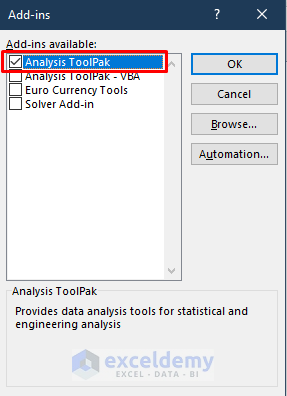
- Select Analysis ToolPak and click OK.
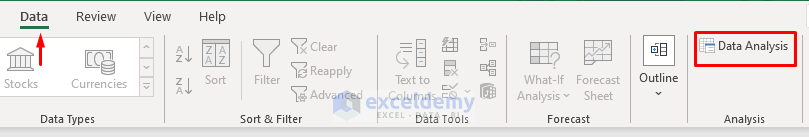
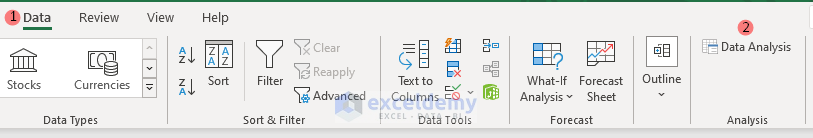
- You will get the Data Analysis option in the Data section.
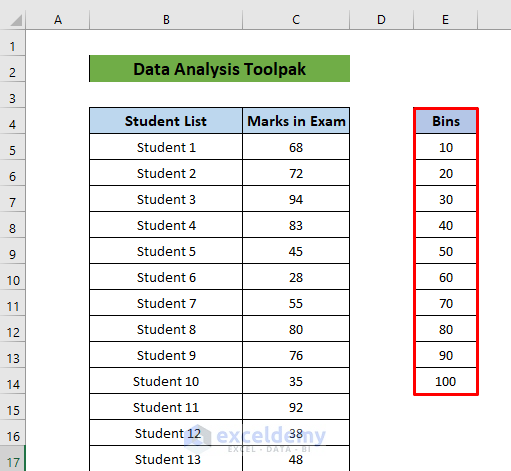
Part 2 – Use the Data Analysis ToolPak to Create a Bin Range
- Create the dataset with an extra column called Bins and enter the upper bin thresholds.
- Go to Data and select Data Analysis.
- Select Histogram from the window and select OK.
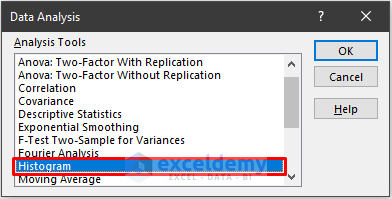
- A Histogram window will pop up.
- In the Input range, select the cells containing the data.
- In the Bin range, select the Bins column. S
- Select the Output range for the result.
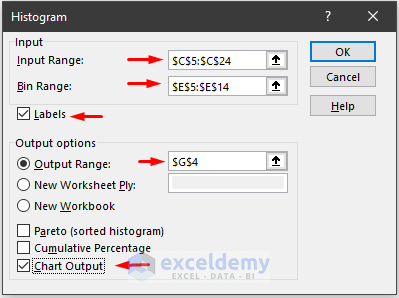
- Select OK and the histogram will show according to the bin ranges.
Read More: How to Make a Histogram in Excel Using Data Analysis
Method 3 – Create a Bin Range Using the FREQUENCY Function
Steps:
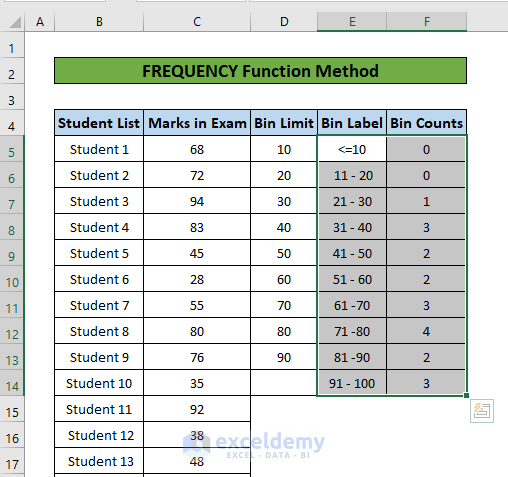
- Add columns for Bin Limit, Bin Label, and Bin Counts.
- Fill up the Bin Limit cells with the upper limit of each bin range.
- In Bin Label, put the Bin ranges.
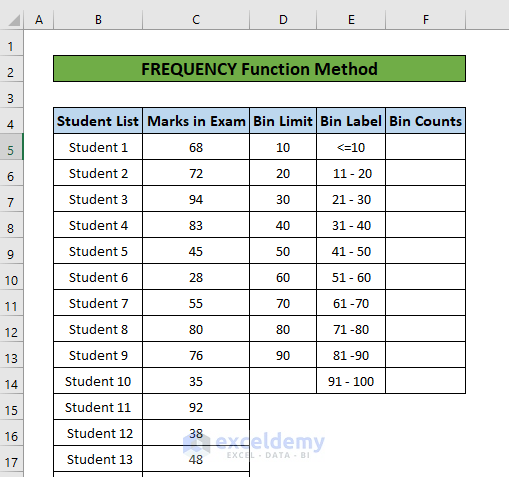
- Enter the following formula in the first cell for Bin counts (F5):
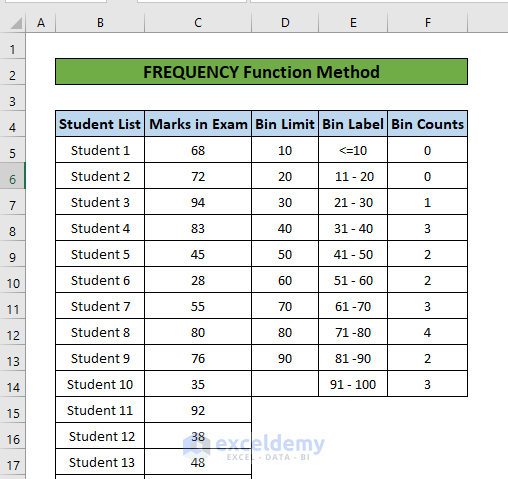
=FREQUENCY(C5:C24, D5:D14)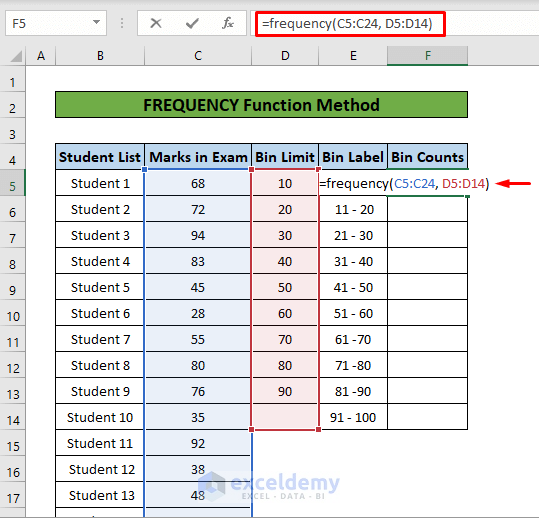
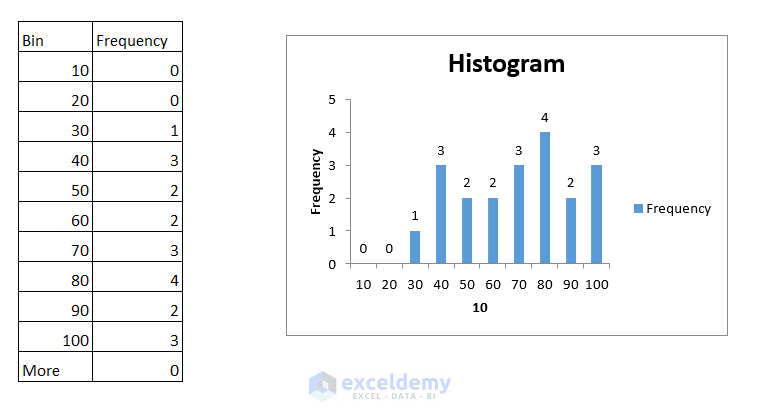
- We have found the counts.
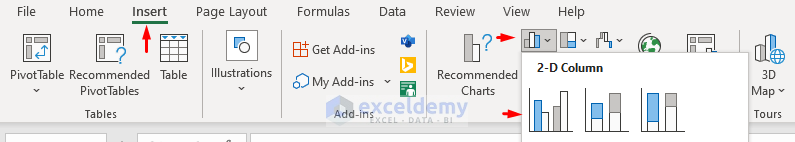
- Select the data for Bin Label and Bin Counts.
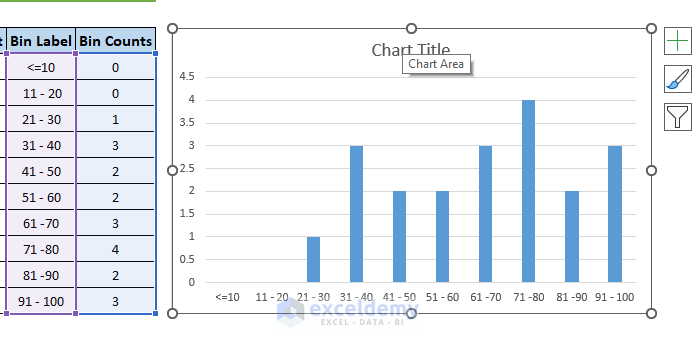
- Go to the Insert tab and select Column Chart and 2D Column.
- Here’s the “histogram” chart.
Download the Practice Workbook
Related Articles
- How to Make a Histogram in Excel with Two Sets of Data
- How to Make a Stacked Histogram in Excel
- Difference Between Excel Histogram and Bar Graph
- How to Change Bin Range in Excel Histogram
- [Fixed!] Excel Histogram Bin Range Not Working
<< Go Back to Excel Histogram | Excel Charts | Learn Excel
Get FREE Advanced Excel Exercises with Solutions!
