In this article we will demonstrate a step-by-step procedure to create a histogram using VBA code in Excel.
What Is a Histogram?
A histogram looks quite similar to a bar chart, except a histogram is the representation of the frequency of data (the number of times that data appears) as rectangular shapes. Instead of specific data, the bars of the histogram can also represent a range of data. We can create a histogram in Excel by using the Statistical Chart feature or by running a simple piece of VBA code.
How to Create Histogram in Excel Using VBA: Step-by-Step Procedures
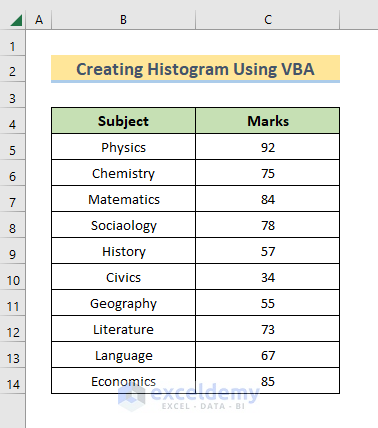
Step 1 – Create Dataset for Histogram
For our demonstration, we have included some numeric values in the Marks column.
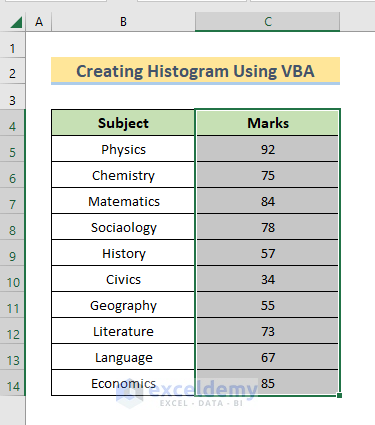
- Select the data in the Marks column including the header.
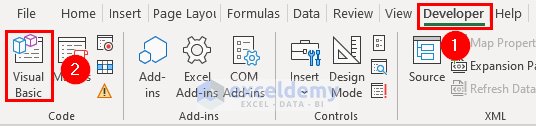
Step 2 – Open VBA Window
- Go to the Developer tab and select Visual Basic to open the VBA window.
- Or, open the VBA window by pressing Alt + F11.
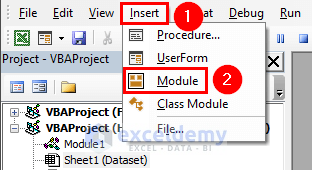
- In the VBA window, select Insert > Module.
Step 3 – Enter Code in the VBA Module
- Copy the following code and paste it in the Module window:
Sub Create_Histogram()
Dim src_sht As Worksheet
Dim new_sht As Worksheet
Dim selected_rng As Range
Dim title As String
Dim x As Integer
Dim scor_cel As Range
Dim num_scores As Integer
Dim count_rng As Range
Dim nw_chart As Chart

    Set selected_rng = Selection
    Set src_sht = ActiveSheet
    Set new_sht = Application.Sheets.Add(After:=src_sht)
    title = selected_rng.Cells(1, 1)
    new_sht.Name = title & " Histogram Using VBA"

    x = 1
    For Each scor_cel In selected_rng.Cells
        If Not IsNumeric(scor_cel.Text) Then
            new_sht.Cells(x, 1) = title & "/Scores"
        Else
            new_sht.Cells(x, 1) = scor_cel
        End If
        x = x + 1
    Next scor_cel
    num_scores = selected_rng.Count

    Const BIN_SIZE As Integer = 10
    Dim num_bins As Integer
    num_bins = 100 \ BIN_SIZE

    new_sht.Cells(1, 2) = "Bins"
    For x = 1 To num_bins - 1
        new_sht.Cells(x + 1, 2) = x * BIN_SIZE - 1
    Next x


    new_sht.Cells(1, 3) = "Frequency"
    Set count_rng = new_sht.Range("C2:C" & num_bins + 1)
    count_rng.FormulaArray = "=FREQUENCY(A2:A" & _
        num_scores & ",B2:B" & num_bins & ")"

    new_sht.Cells(1, 4) = "Score Range"
    For x = 1 To num_bins - 1
        new_sht.Cells(x + 1, 4) = "'" & _
            10 * (x - 1) & "-" & _
            10 * (x - 1) + 9
        new_sht.Cells(r + 1, 4).HorizontalAlignment = _
            xlRight
    Next x
    x = num_bins
    new_sht.Cells(x + 1, 4) = "'" & _
        10 * (x - 1) & "-100"
    new_sht.Cells(x + 1, 4).HorizontalAlignment = xlRight

    Set nw_chart = Charts.Add()
    With nw_chart
        .ChartType = xlColumnClustered
        .SetSourceData Source:=new_sht.Range("C2:C" & _
            num_bins + 1), _
            PlotBy:=xlColumns
        .Location Where:=xlLocationAsObject, _
            Name:=new_sht.Name
    End With

    With ActiveChart
        .HasTitle = True
        .ChartTitle.Characters.Text = title & " Histogram Using VBA"
        .Axes(xlCategory, xlPrimary).HasTitle = True
        .Axes(xlCategory, _
            xlPrimary).AxisTitle.Characters.Text = "Marks/Scores"
        .Axes(xlValue, xlPrimary).HasTitle = True
        .Axes(xlValue, xlPrimary).AxisTitle.Characters.Text _
 _
            = "Frequency"

        .SeriesCollection(1).XValues = "='" & _
            new_sht.Name & "'!R2C4:R" & _
            num_bins + 1 & "C4"
    End With
    ActiveChart.SeriesCollection(1).Select
    With ActiveChart.ChartGroups(1)
        .Overlap = 0
        .GapWidth = 0
        .HasSeriesLines = False
        .VaryByCategories = False
    End With

    x = num_scores + 2
    new_sht.Cells(x, 1) = "Average"
    new_sht.Cells(x, 2) = "=AVERAGE(A1:A" & num_scores & _
        ")"
    x = x + 1
    new_sht.Cells(x, 1) = "Std. Deviation"
    new_sht.Cells(x, 2) = "=STDEV(A1:A" & num_scores & ")"
End Sub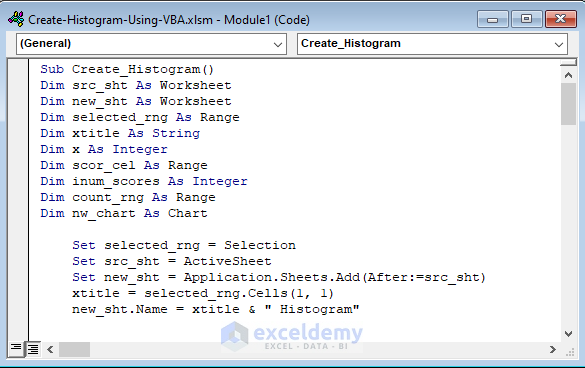
Code Explanation
- We declare a sub-procedure named Create_Histogram, and some variables:
Sub Create_Histogram()
Dim src_sht As Worksheet
Dim new_sht As Worksheet
Dim selected_rng As Range
Dim xtitle As String
Dim x As Integer
Dim scor_cel As Range
Dim inum_scores As Integer
Dim count_rng As Range
Dim nw_chart As Chart- We copy the data to the new sheet.
Set selected_rng = Selection
Set src_sht = ActiveSheet
Set new_sht = Application.Sheets.Add(After:=src_sht)
xtitle = selected_rng.Cells(1, 1)
new_sht.Name = xtitle & " Histogram Using VBA"- We create a new sheet.
x = 1
For Each scor_cel In selected_rng.Cells
If Not IsNumeric(scor_cel.Text) Then
new_sht.Cells(x, 1) = xtitle & " /Scores"
Else
new_sht.Cells(x, 1) = scor_cel
End If
x = x + 1
Next scor_cel
num_scores = selected_rng.Count- We create bin separators.
Const BIN_SIZE As Integer = 10
Dim num_bins As Integer
num_bins = 100 \ BIN_SIZE- We count the bins.
new_sht.Cells(1, 2) = "Bins"
For x = 1 To num_bins - 1
new_sht.Cells(x + 1, 2) = x * BIN_SIZE - 1
Next x- We create the range labels.
new_sht.Cells(1, 3) = "Frequency"
Set count_rng = new_sht.Range("C2:C" & num_bins + 1)
count_rng.FormulaArray = "=FREQUENCY(A2:A" &num_scores & ",B2:B" & num_bins & ")"- We perform the counts.
new_sht.Cells(1, 4) = "Score Range"
For x = 1 To num_bins - 1
new_sht.Cells(x + 1, 4) = "'" &10 * (x - 1) & "-" &10 * (x - 1) + 9
new_sht.Cells(x + 1, 4).HorizontalAlignment =xlRight
Next x
x = num_bins
new_sht.Cells(x + 1, 4) = "'" &10 * (x - 1) & "-100"
new_sht.Cells(x + 1, 4).HorizontalAlignment = xlRight
- We create the chart.
Set nw_chart = Charts.Add()
With nw_chart
.ChartType = xlColumnClustered
.SetSourceData Source:=new_sht.Range("C2:C" &num_bins + 1),PlotBy:=xlColumns
.Location Where:=xlLocationAsObject,Name:=new_sht.Name
End With
With ActiveChart
.HasTitle = True
.ChartTitle.Characters.Text = xtitle & " Histogram Using VBA"
.Axes(xlCategory, xlPrimary).HasTitle = True
.Axes(xlCategory, _
xlPrimary).AxisTitle.Characters.Text = "/Scores"
.Axes(xlValue, xlPrimary).HasTitle = True
.Axes(xlValue, xlPrimary).AxisTitle.Characters.Text= "Frequency"- We display score ranges on the X-axis of the chart.
.SeriesCollection(1).XValues = "='" &new_sht.Name & "'!R2C4:R" &num_bins + 1 & "C4"
End With
ActiveChart.SeriesCollection(1).Select
With ActiveChart.ChartGroups(1)
.Overlap = 0
.GapWidth = 0
.HasSeriesLines = False
.VaryByCategories = False
End With
x = num_scores + 2
new_sht.Cells(x, 1) = "Average"
new_sht.Cells(x, 2) = "=AVERAGE(A1:A" & num_scores &")"
x = x + 1
new_sht.Cells(x, 1) = "StdDev"
new_sht.Cells(x, 2) = "=STDEV(A1:A" & num_scores & ")"
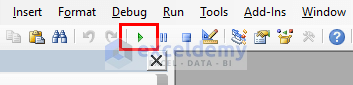
End SubStep 4 – Run Code to Create Histogram
- Click the Run button.
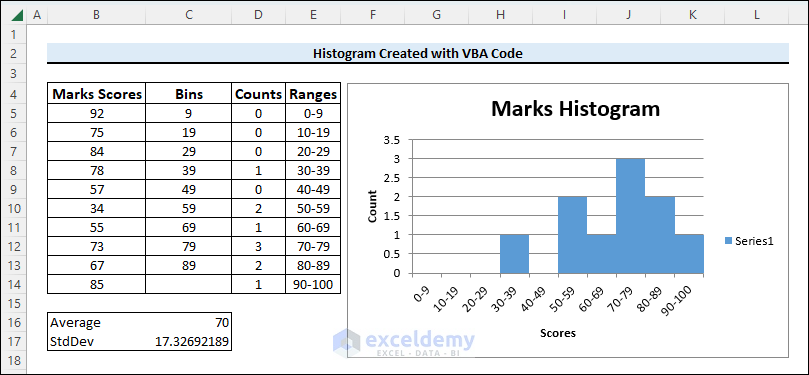
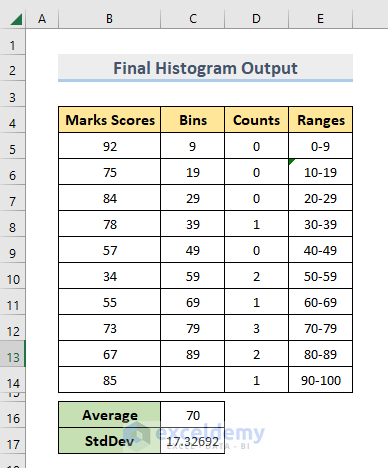
Final Histogram Output:
A Marks Histogram worksheet will be created containing the data for the histogram.
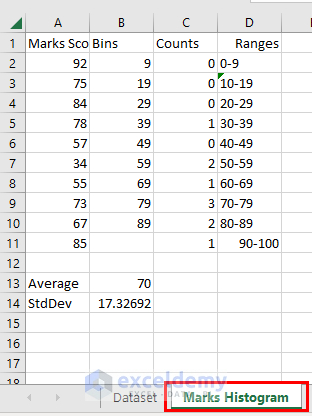
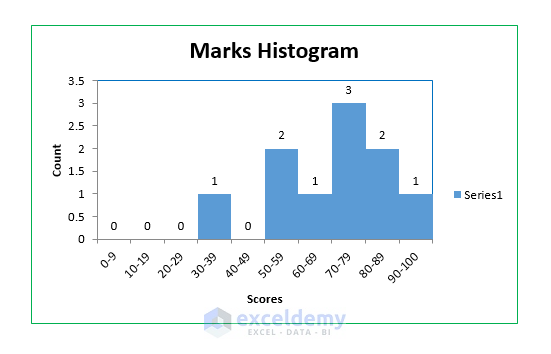
Also, a histogram is created in the same worksheet.

- Perform a bit of formatting on the output dataset.
- Do some formatting (like providing labels, creating colored borders, etc.) on the histogram.
Read More: How to Create Probability Histogram in Excel
Download Practice Workbook
Related Articles
- How to Create a Histogram with Bell Curve in Excel
- How to Add Vertical Line to Histogram in Excel
- Stock Return Frequency Distributions and Histograms in Excel
<< Go Back to Excel Histogram | Excel Charts | Learn Excel
Get FREE Advanced Excel Exercises with Solutions!
