Download Practice Workbook
Download the practice workbook.
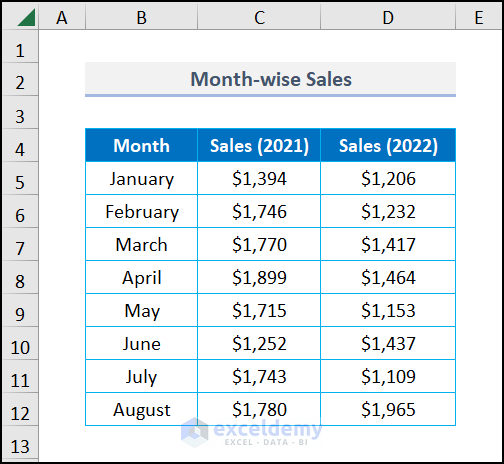
Step 1 – Populate the Dataset
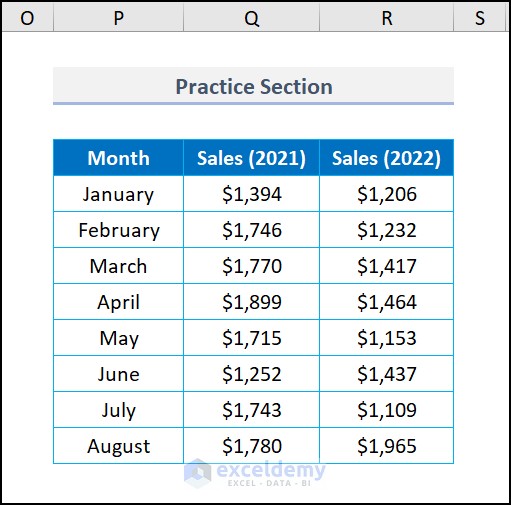
- The sample dataset showcases Month-wise Sales in 2 years.
Read More: How to Resize Chart Area Without Resizing Plot Area in Excel
Step 2 – Insert a Chart
- Select the entire dataset.
- Go to the Insert tab >> choose Insert Column or Bar Chart >> Clustered Column.
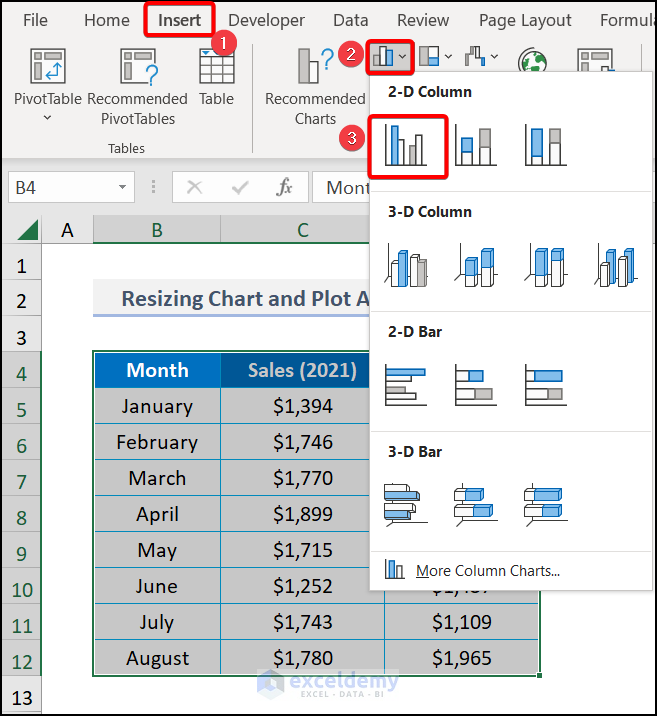
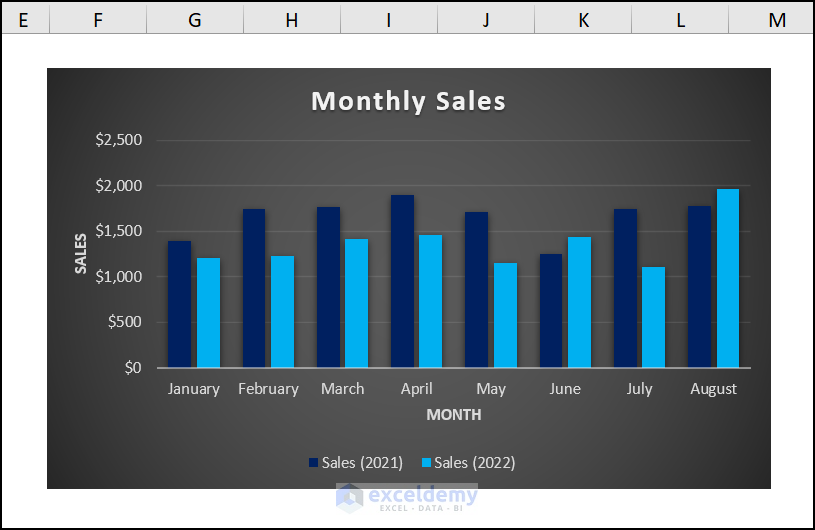
A chart will be displayed.
Read More: How to Create an Area Chart in Excel (6 Suitable Examples)
Similar Readings
- Create Stacked Area Chart with Negative Values in Excel
- How to Shade an Area of a Graph in Excel (With Easy Steps)
- Change Order of Excel Stacked Area Chart (with Quick Steps)
Step 3 – Use a VBA Code to Resize the Chart Plot Area
- Select the chart area and go to the Developer tab >> select Visual Basic.
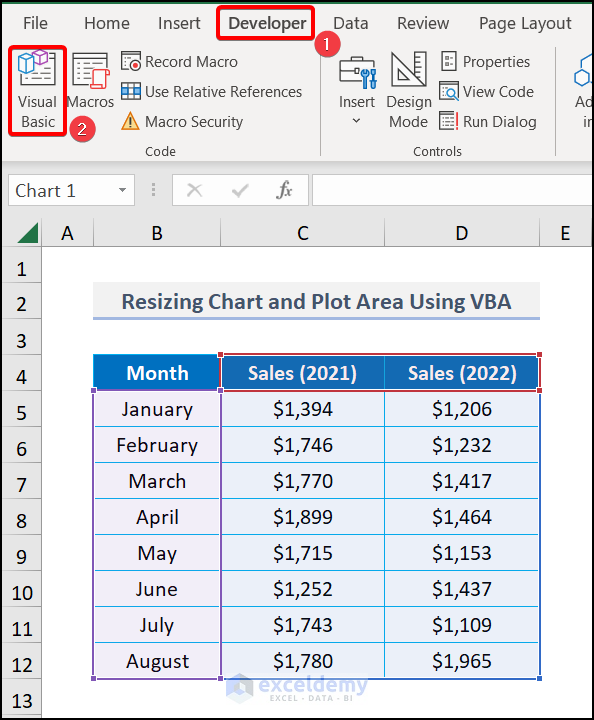
Note: you can also open the VBA Editor by pressing ALT + F11.
- Select Insert >> Module>> Module1.
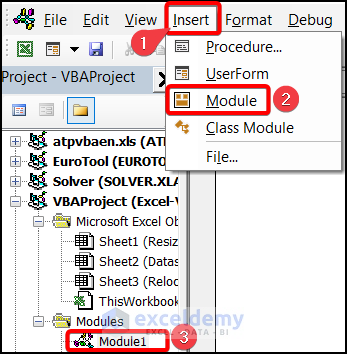
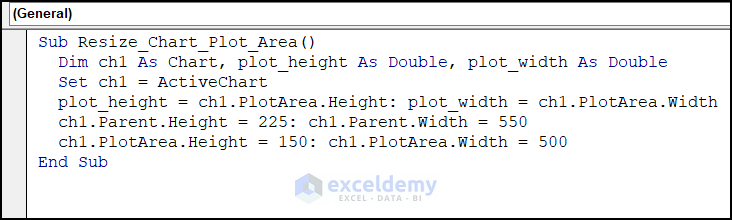
- Enter the following code in Module 1.
Sub Resize_Chart_Plot_Area()
  Dim ch1 As Chart, plot_height As Double, plot_width As Double
  Set ch1 = ActiveChart
  plot_height = ch1.PlotArea.Height: plot_width = ch1.PlotArea.Width
  ch1.Parent.Height = 225: ch1.Parent.Width = 550
  ch1.PlotArea.Height = 150: ch1.PlotArea.Width = 500
End Sub
Code Breakdown:
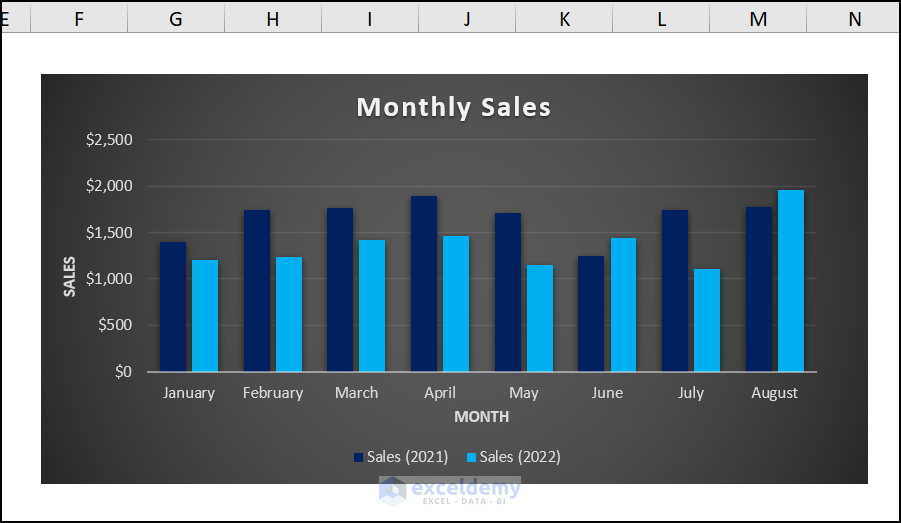
- Run the code by pressing F5.
The chart will automatically be resized:
Read More: Excel Area Chart Data Label & Position
How to Move a Chart to a Specific Cell with VBA in Excel
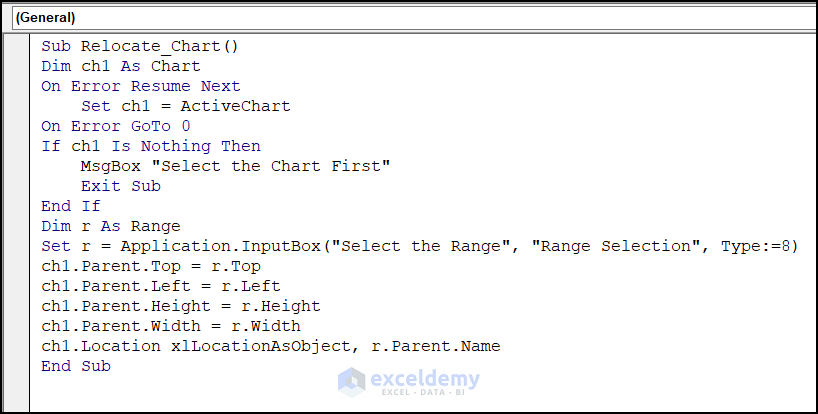
- Open a new module and enter the following code:
Sub Relocate_Chart()
Dim ch1 As Chart
On Error Resume Next
    Set ch1 = ActiveChart
On Error GoTo 0
If ch1 Is Nothing Then
    MsgBox "Select the Chart First"
    Exit Sub
End If
Dim r As Range
Set r = Application.InputBox("Select the Range", "Range Selection", Type:=8)
ch1.Parent.Top = r.Top
ch1.Parent.Left = r.Left
ch1.Parent.Height = r.Height
ch1.Parent.Width = r.Width
ch1.Location xlLocationAsObject, r.Parent.Name
End Sub
- Add a button utilizing the Form Controls in your worksheet. Named it Relocate.
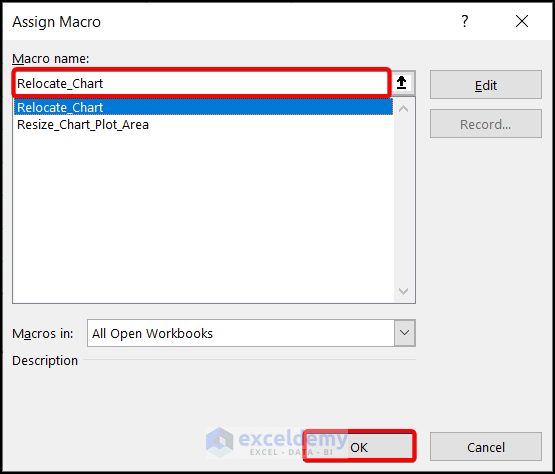
- Right-click the button and choose Assign Macro.
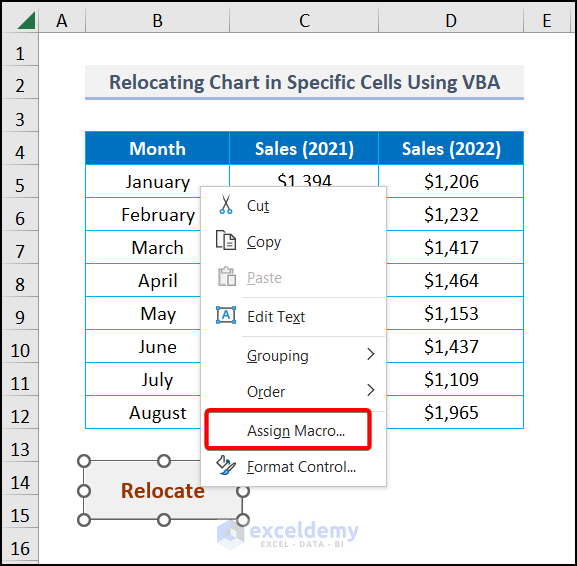
- Select the Macro Relocate_Chart.
- Click OK.
- Select the range to place the chart.
See the output in the GIF below.
Practice Section
Practice here.
Related Articles
- How to Create Radar Chart with Fill Area in Excel (2 Easy Methods)
- How to Create Circular Area Chart in Excel (With Detailed Steps)
- Shade Area Between Two Lines in a Chart in Excel
- How to Make Smooth Area Chart in Excel (with Easy Steps)


Hi Sir,
Have a good day.
If i want to resize the plot area but my chart area need to be fixed. Can it be done? If yws, then what modification should be needed?
Hello Terry,
It’s really nice to hear from you. In your query, you wanted to know about changing the plot area where the chart area will be the same. The VBA code needs to be modified a bit. I have attached the code below.
Sub Resize_Chart_Plot_Area()Dim ch1 As Chart, plot_height As Double, plot_width As DoubleSet ch1 = ActiveChartchart_height = ch1.PlotArea.Height: chart_width = ch1.PlotArea.Widthchart_height = ch1.PlotArea.Height: chart_width = ch1.PlotArea.Widthch1.PlotArea.Height = 150: ch1.PlotArea.Width = 400End SubRun the code with the F5 key and it will change the plot area without changing the plot area.
Have a great day.
Regards,
Fahim Shahriyar Dipto
Excel & VBA Content Developer.
Hello,
Can one also fix the position of the plot area withing the chart? I used your code and it does make the sizes what I want, but because the legend changes size for different plots, the plot area shifts within the chart area and I want it to stay in a fixed location so it does not jump around whilst scrolling through the slides. I do not mind if the legend moves a bit, but it would be nice to fix that too.
Thank you,
Timo
Hello Timo,
Yes, you can fix the position of the plot area within the chart using VBA by explicitly setting the .Top and .Left properties of the plot area. This way, it will stay in a fixed location regardless of legend size. For example:
If you’d like to keep the legend from resizing as well, you can set its .AutoScaleFont property to False and define fixed dimensions using .Width, .Height, .Top, and .Left:
This approach should keep both the plot area and legend from shifting while scrolling through slides. Let me know if you need further customization!
Regards
ExcelDemy