Excel is a very useful tool for plotting different kinds of charts. Excel offers various options to format the plotted charts to make it look more attractive. While making a smooth line chart is an easy task in Excel, one might find it difficult to make a smooth area chart in Excel. In this article, we will walk you through five steps to make a smooth area chart in Excel.
How to Make Smooth Area Chart in Excel (With Easy Steps)
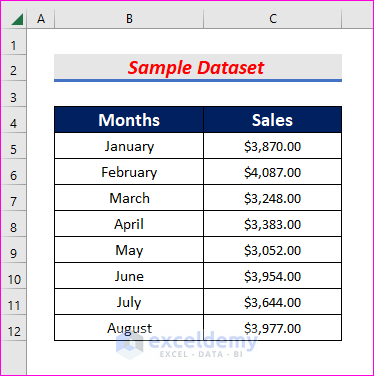
In this article, we will demonstrate five easy steps to make a smooth area chart in Excel. We will use the following dataset for this purpose.
Step 1: Insert an Area Chart
In the first step, we will create an area chart using the dataset.
- First of all, select all the data from the Months and Sales columns.
- Then click on the Insert tab and go to,
Insert → Charts → Insert Line or Area Chart → Area
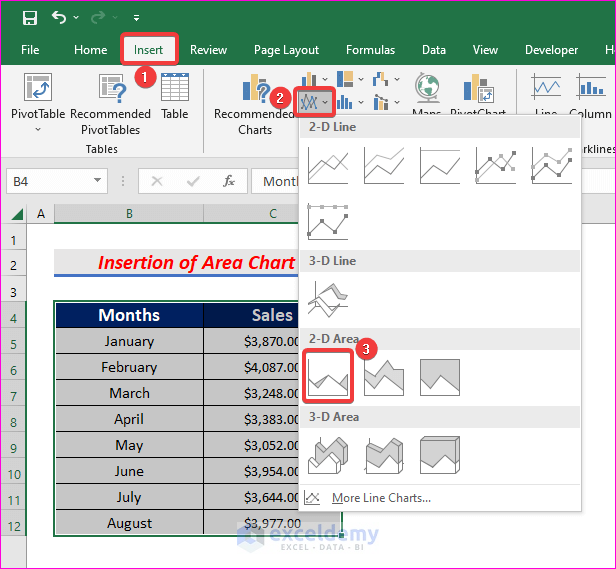
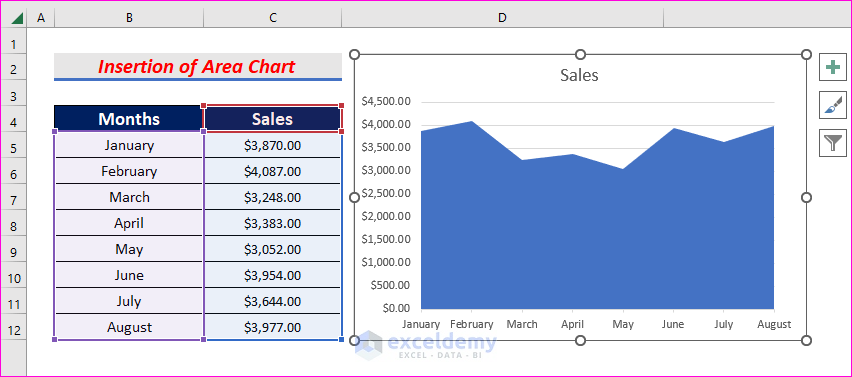
- Hence, the area chart will be created.
Read More: Excel Area Chart Data Label Position
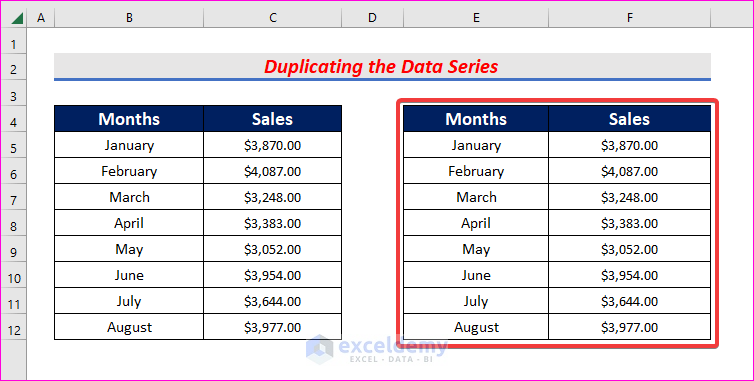
Step 2: Duplicate Data Series
In this step, we need to duplicate the data series to add a new chart to make a smooth area chart in Excel.
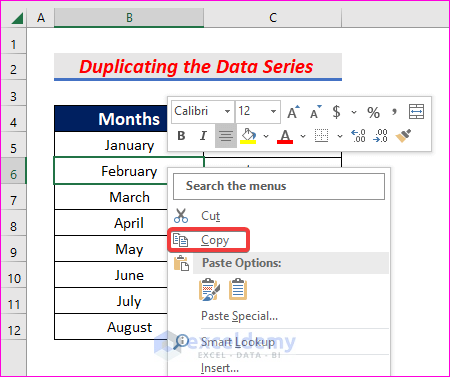
- First, select both Months and Sales columns.
- Then press the right button of your mouse and click on Copy.
- After that, paste it into your preferred cells.
Step 3: Add New Chart
Now we will add a new chart using the duplicated data series.
- First, right-click on the chart and click on Select Data.
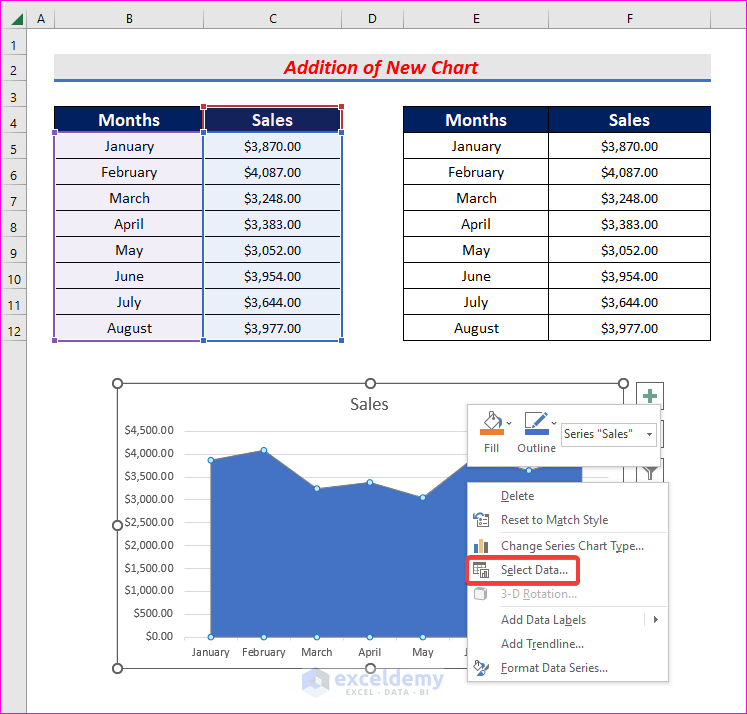
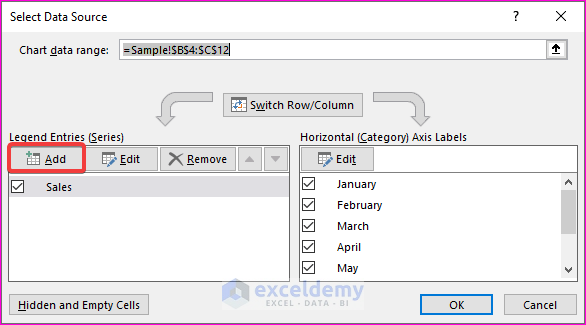
- As a result, the Select Data Source dialog box will appear.
- From the dialog box, select Add.
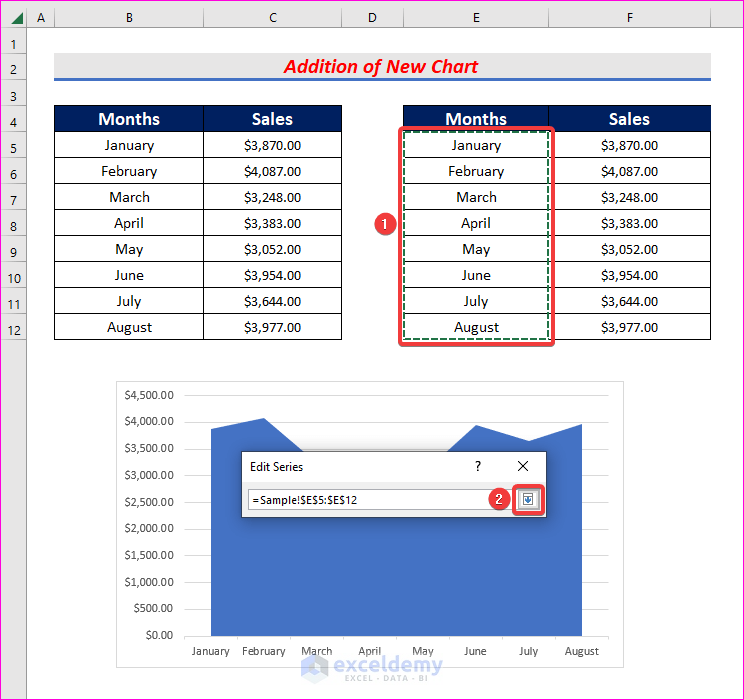
- The Edit Series pop-up will open. Click on the arrow under the Series name.
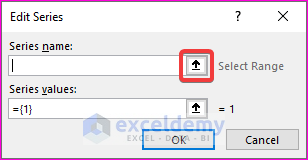
- Then select the Months column and click on the arrow.
- Similarly, click on the arrow under Series values.
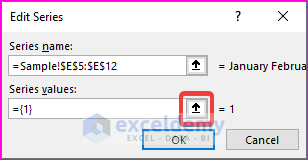
- Then select the Sales column and click on the arrow.
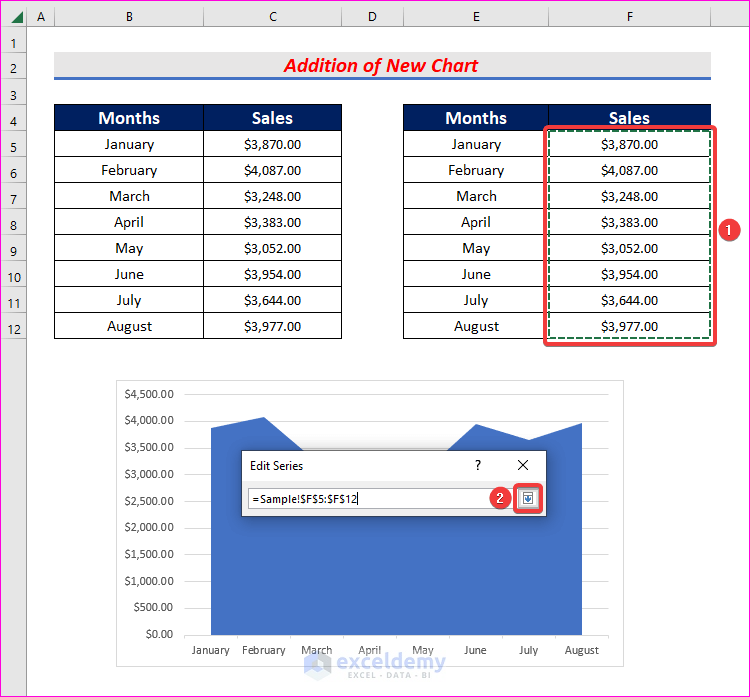
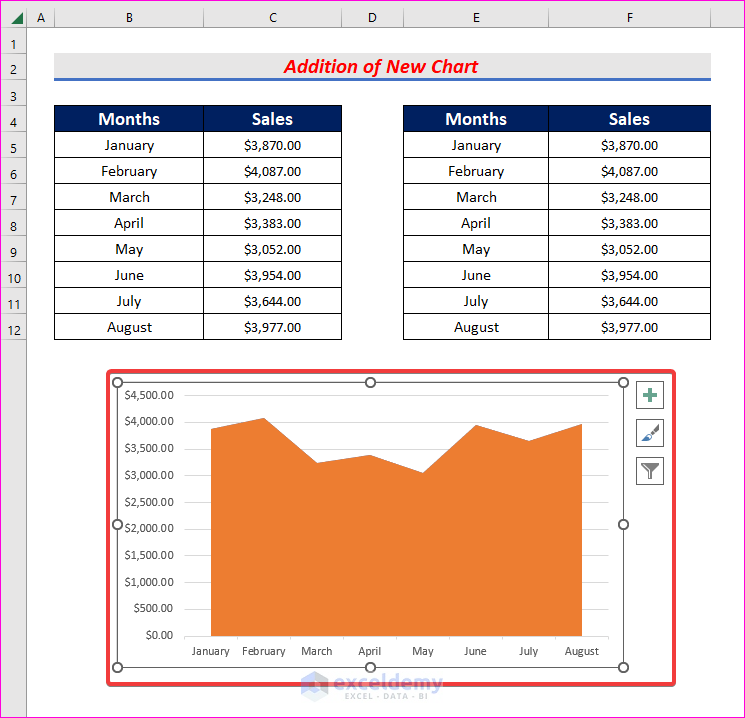
- After that, press Enter twice to get the new chart added to the old one.
Read More: Excel Stacked Area Chart Negative Values
Step 4: Change Chart Type
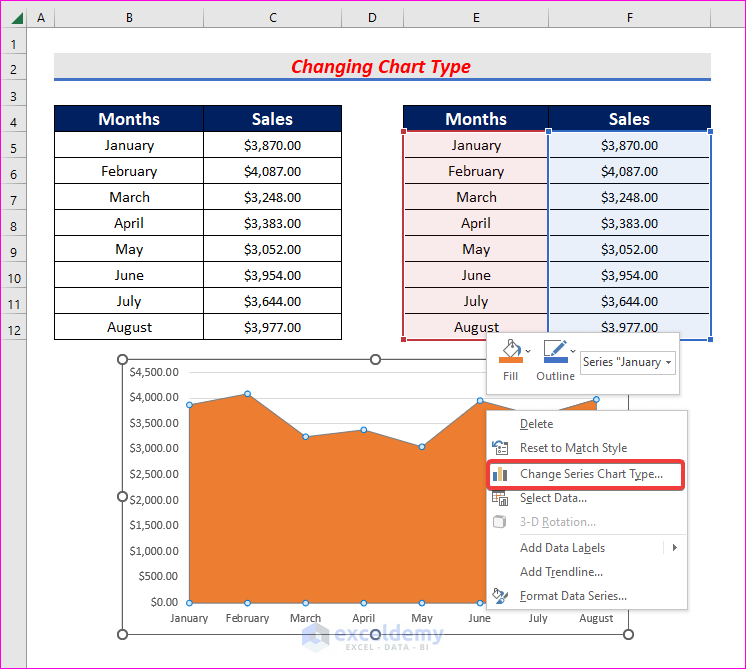
In this step, we will change the type of the newly added chart.
- First of all, right-click on the chart and select Change Series Chart Type.
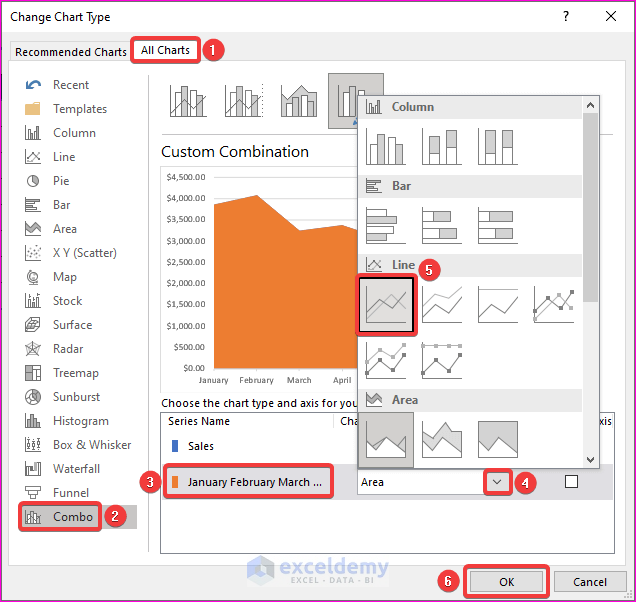
- The Change Chart Type window will pop up.
- In the window, go to the All Charts tab and click on Combo.
- Then choose the new chart under Series Name.
- Next, change the chart type to Line from Area.
- After that, click OK.
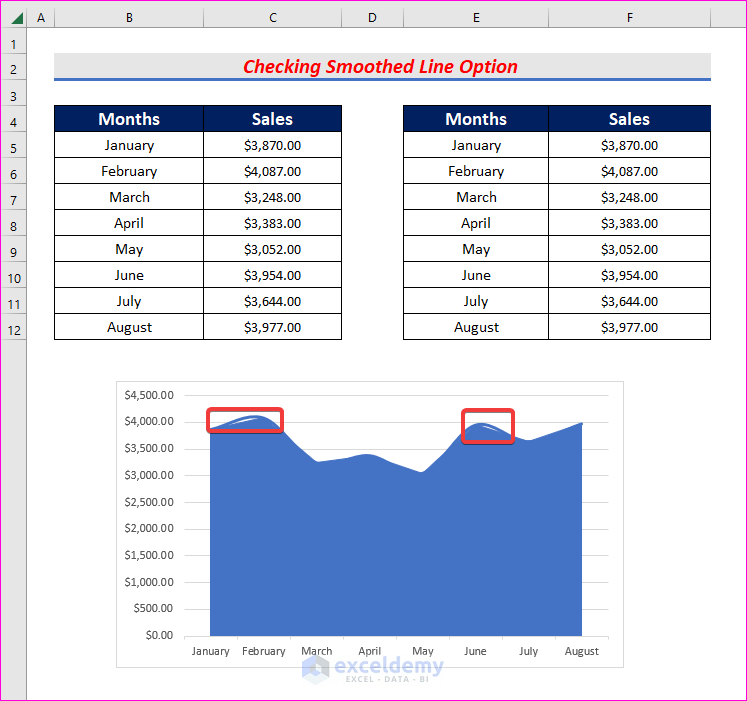
Step 5: Check Smoothed Line Option
In the final step, we will smooth out the line option to make a smooth area chart in Excel.
- First, right-click on the Line chart and click on Format Data Series.
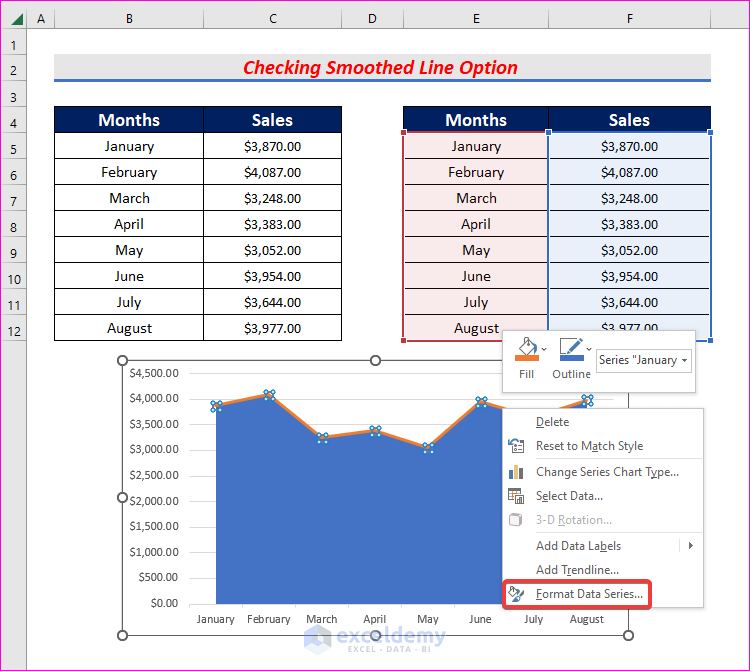
- As a result, the Format Data Series panel will open on the right side of the Excel sheet.
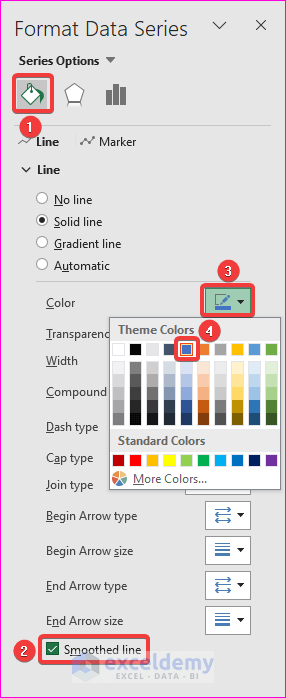
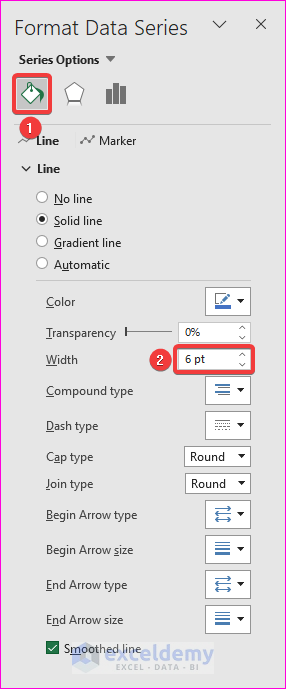
- In the panel, click on Fill & Line from the Series Options.
- Then check the box of the Smoothed line option.
- Finally, change the color to the same as the Area chart.
- Now, if you look at the chart, you might see small gaps between the Line and Area chart.
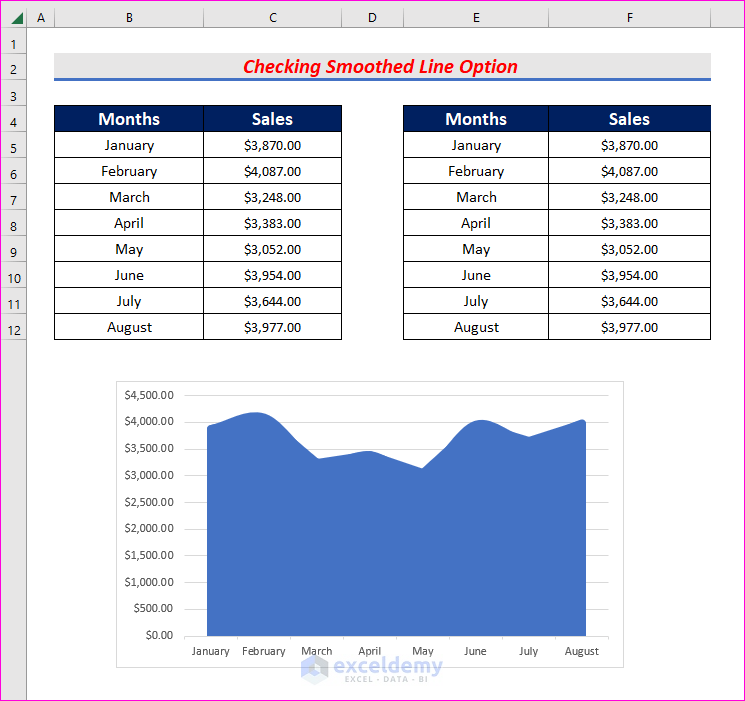
- To get rid of the small gaps, increase the Width of both the Line and Area chart.
- Consequently, you will have your desired smooth area chart in your Excel sheet.
- Create both the Line and Area chart in the same color.
- If there are small gaps between the Line and Area chart, increase the width of both charts.
Download Practice Workbook
Download this practice workbook to exercise while you are reading this article.
Conclusion
Thanks for making it this far. I hope you find this article useful. Now you know five easy steps to make a smooth area chart in Excel. Please let us know if you have any further queries, and feel free to give us any recommendations in the comment section below.
Related Articles
- Proportional Area Chart Excel
- How to Shade an Area of a Graph in Excel
- Excel Stacked Area Chart Change Order
<< Go Back To Excel Area Chart | Excel Charts | Learn Excel
Get FREE Advanced Excel Exercises with Solutions!
