While working in Microsoft Excel with the sales-related worksheets, sometimes we need to stack area charts with lines. The area chart shows you a trend in the share of total sales that they contribute, NOT a trend in their absolute value. Stacking an area chart with lines in Excel is an easy task. This is a time-saving task also. Today, in this article, we’ll learn two quick and suitable examples of how Excel stacked area charts with lines effectively with appropriate illustrations.
Introduction to Area Chart with Line
Typically, the stacked area chart is what is meant when the phrase “area chart” is used. Each line was darkened in the overlapped area chart from its vertical value to a shared baseline. The height of the most recent group is used as a shifting baseline in the stacked area chart, which plots lines one at a time. As a result, the sum of the values for all groups will be equal to the fully-stacked height of the topmost line.
When you wish to track not only the overall value but also the breakdown of that total by groups, you will utilize a stacked area chart. We can obtain a basic picture of how each subgroup compares to the others in terms of their contributions to the total by comparing the heights of each section of the curve.
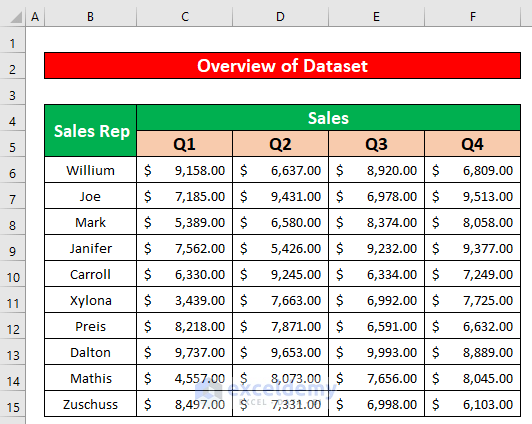
Let’s say, we have a dataset that contains information about several Sales representatives of XYZ group. The Name of the Sales representatives and their sales in several quarters are given in columns B, C, D, and E respectively. From our dataset, we will create a stacked area chart with lines, and we will apply the Insert ribbon to the stacked area chart with lines in Excel. Here’s an overview of the dataset for today’s task.
1. Creating 2D Stacked Area Chart with Line in Excel
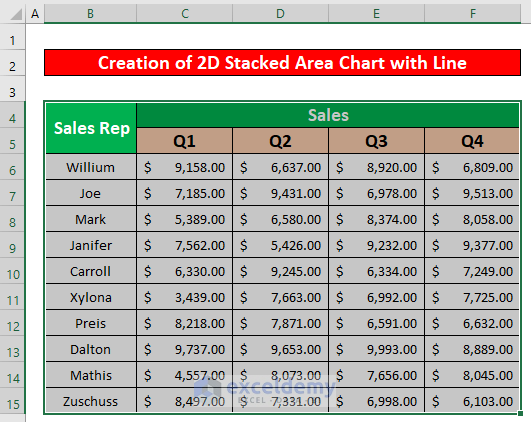
Now, in this portion, using Insert ribbon, we will import a stacked 2-D area chart with lines from our dataset. This is an easy task. This is a time-saving task also. Let’s follow the instructions below to create a stacked area chart with lines in Excel!
- First of all, select the range of data to stack the area chart with lines. From our dataset, we select B4 to F15 for the convenience of our work.
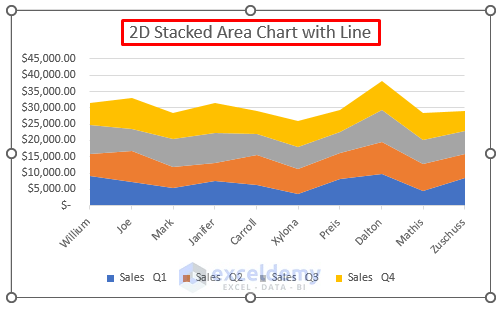
- After selecting the data range, from your Insert ribbon, go to,
Insert → Charts → Insert Line or Area Chart Icon → 2-D Area

- As a result, you will be able to stack a 2-D area chart with lines using the dataset that has been given in the below screenshot.
Read More: How to Create an Area Chart in Excel
2. Showing a 3D Stacked Area Chart with Line in Excel
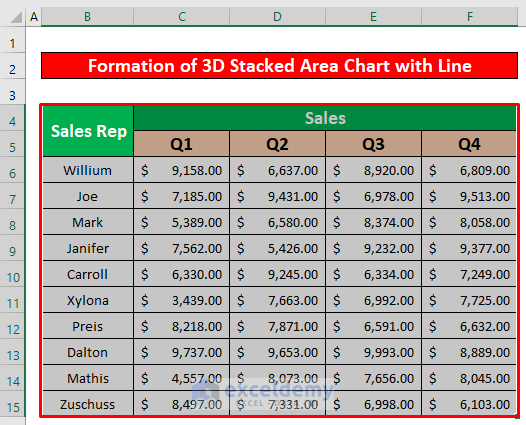
After learning the 2D stacked area chart, in this method, using Insert ribbon, we will learn how Excel stacked the 3-D area chart with lines from our dataset. This is an easy task. This is a time-saving task also. Let’s follow the instructions below to create a stacked 3-D area chart with lines in Excel!
- First of all, select the range of data to stack the area chart with lines. From our dataset, we select B4 to F15 for the convenience of our work.
- Hence, from your Insert ribbon, go to,
Insert → Charts → Insert Line or Area Chart Icon → 3-D Area

- As a result, you will be able to stack a 3-D area chart with lines using the dataset that has been given in the below screenshot.

Read More: Excel Stacked Area Chart Change Order
Things to Remember
👉 #N/A! error arises when the formula or a function in the formula fails to find the referenced data.
👉 #DIV/0! error happens when a value is divided by zero(0) or the cell reference is blank.
Download Practice Workbook
Download this practice workbook to exercise while you are reading this article.
Conclusion
I hope all of the suitable examples mentioned above for Excel stacked area charts with lines will now provoke you to apply them in your Excel spreadsheets with more productivity. You are most welcome to feel free to comment if you have any questions or queries.
Related Articles
- Excel Stacked Area Chart Negative Values
- Proportional Area Chart Excel
- Smooth Area Chart Excel
- How to Shade an Area of a Graph in Excel
- Excel Area Chart X-axis Scale
- Excel Area Chart Data Label Position
<< Go Back To Excel Area Chart | Excel Charts | Learn Excel
Get FREE Advanced Excel Exercises with Solutions!
