Solving equations is one of the most useful mathematical functions as it gives us an immense opportunity to solve many real-life problems. In this article, we will discuss 3 effective methods you can follow to show the intersection point in a graph in Excel with elaborate explanations.
How to Show Intersection Point in Excel Graph: 3 Effective Methods
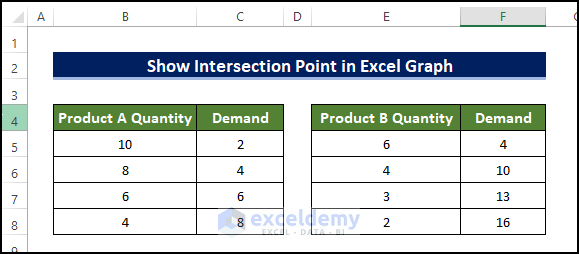
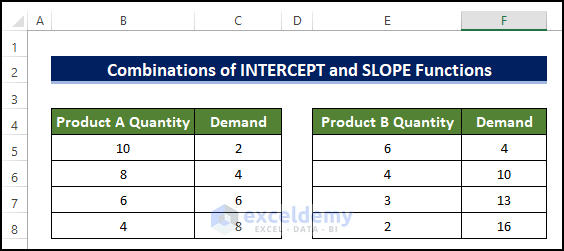
Here, the below dataset is going to be used to determine the intersection point between two linear lines in Excel. To avoid any kind of compatibility issue, use Excel 365 edition.
1. Manually Solve System of Equations to Show Intersection Point
A manual visual aid is going to be used here as a way to show intersection points between two lines. Although this method is not completely perfect, for quick and moderate reliability, this method works just fine. Therefore, learn the following steps to show the intersection point in an Excel graph.
Steps:
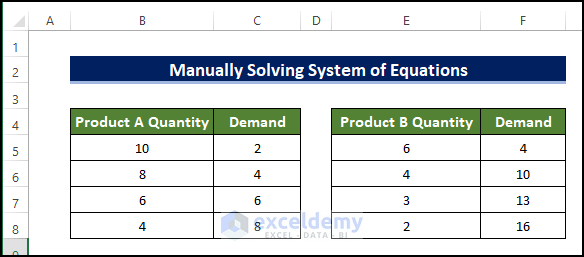
- Here, we got the information about the products and their demands illustrated in the tables below.
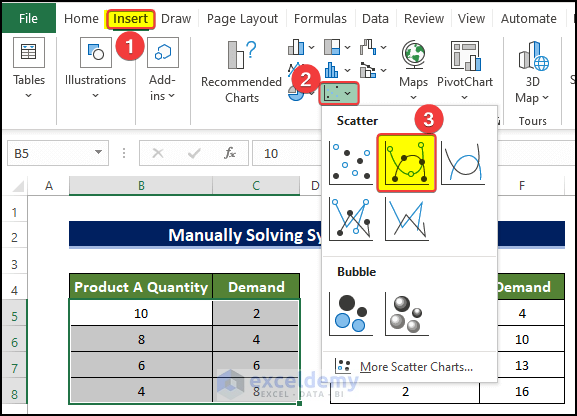
- First, select the range of cell B5:C8.
- , we now create a scatter plot out of the info given. For this, go to Insert tab > Insert Scatter > Scatter with Smooth Line and Marker.
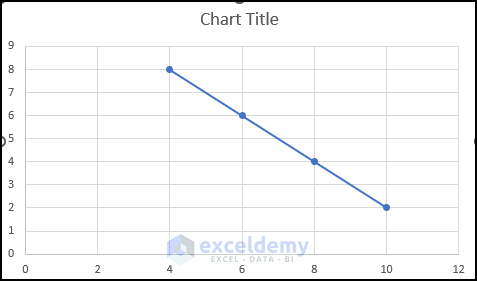
- Then we will notice that the line is now a linear scatter plot is present.
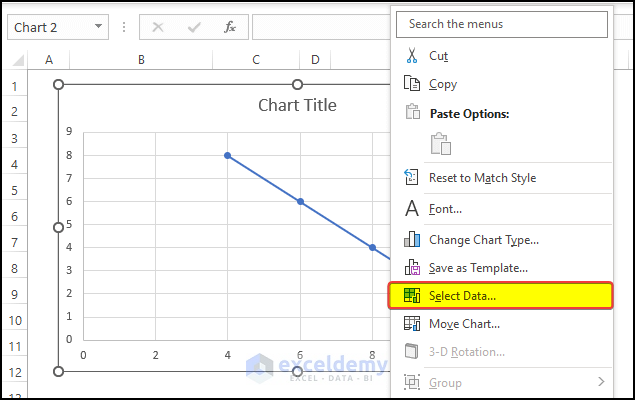
- Next, to add the second table of information as the second scatter plot, right-click on the plot and click on Select Data.
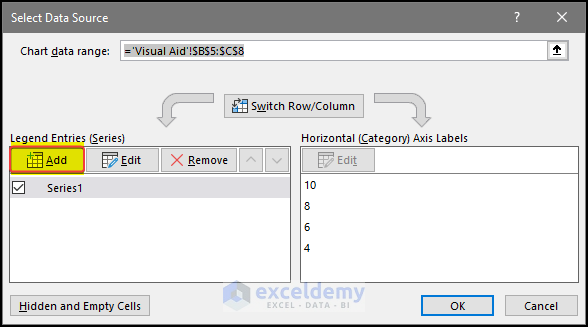
- Next, in the Select Data Source window, click on the Add Command.
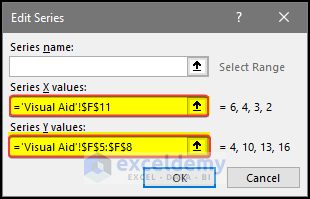
- Moreover, in the edit series window, you need to select the range of cell G5:G8 in the first range box and the range of cell F5:F8 in the second range box.
- Then click on OK after that.
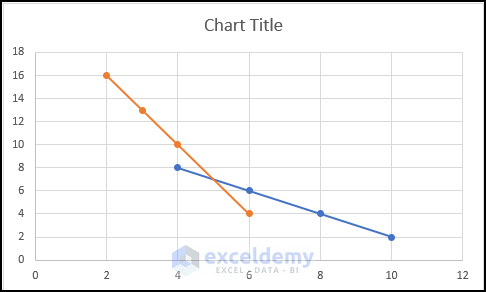
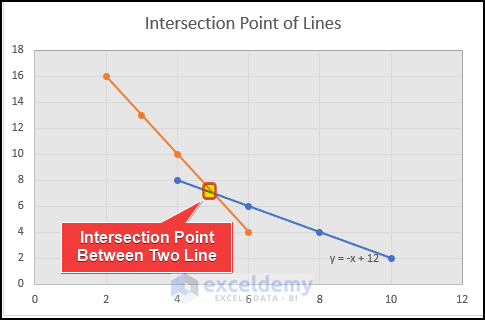
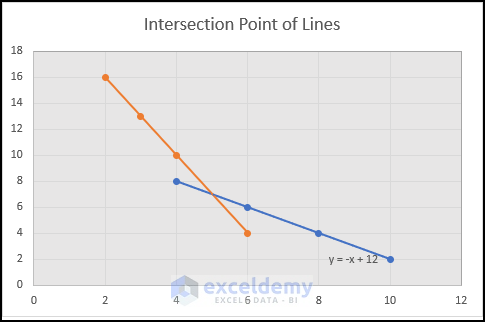
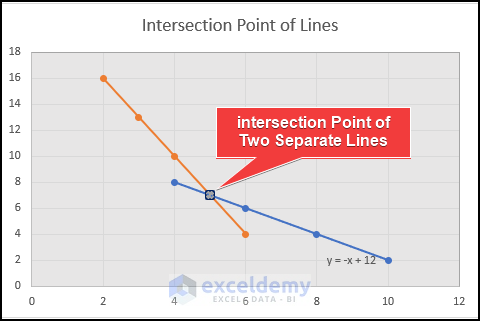
- After clicking OK, we are going to notice that the second line is also present in the existing scatter plot.
- Now, It is quite evident that both of the lines are actually intersected.
- Upon further investigation, we can conclude that the point is 5 units ahead of the origin of the plot and 7 units above the origin.
- So, the intersection point coordinate has to be (5,7).
Read More: How to Find Intersection of Two Curves in Excel
2. Display Intersection Point in Graph Through Excel Solver Tool
A Solver tool is a powerful tool that can solve a multitude of problems quite efficiently. Solving equations is one of those. Here, we will use the Solver tool to solve two equations to get their intersection point. So, follow the steps below to show the intersection point in the Excel graph.
Steps:
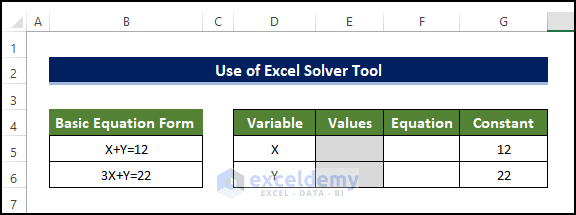
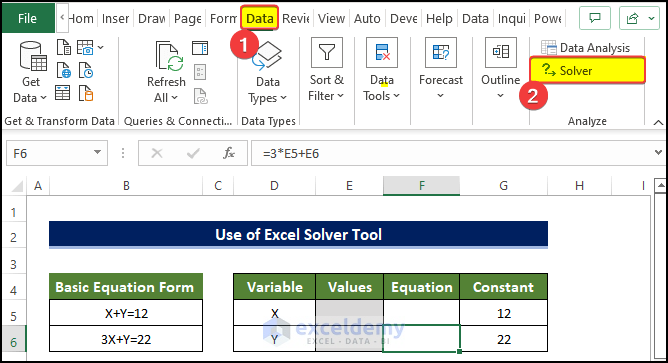
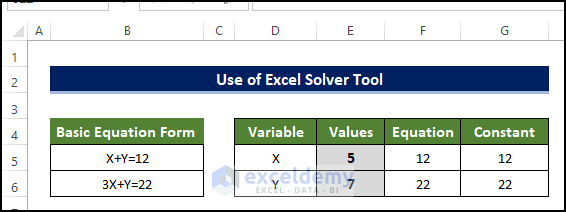
- First, we need to have the main equation of the lines in front of us.
- Then we need to reformat our sheet as shown below.
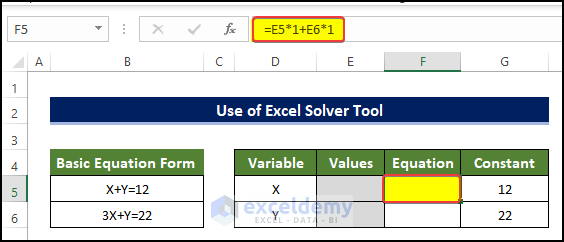
- Then select cell F5 and enter the following formula:
=E5*1+E6*1
Here the numbers multiplied are the coefficients of each of the equations.
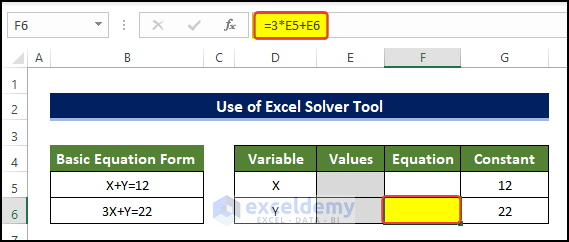
- Then select the cell F6 and enter the following formula:
=3*E5+E6
Here the number multiplied is the coefficient of each of the equations.
- Then, select the Solver command from the Data tab.
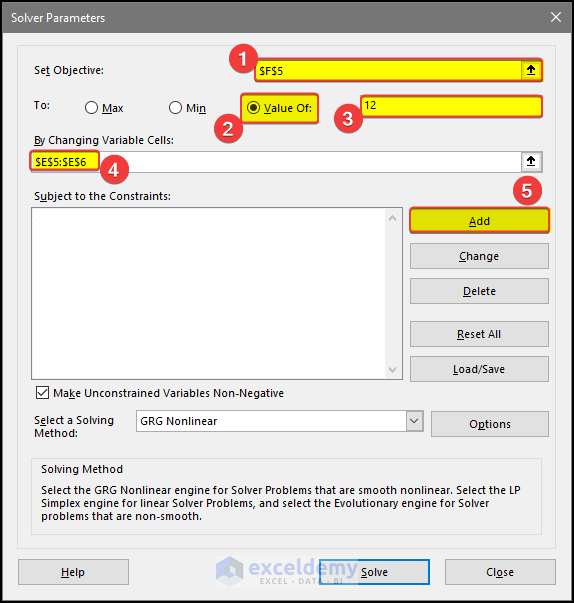
- After that, set the objective by selecting the F5 key.
- Then select Value of and input 12 in the box.
- In the By Changing Variable Cells box, select the range of cells E5:E6.
- Click on Next after that.
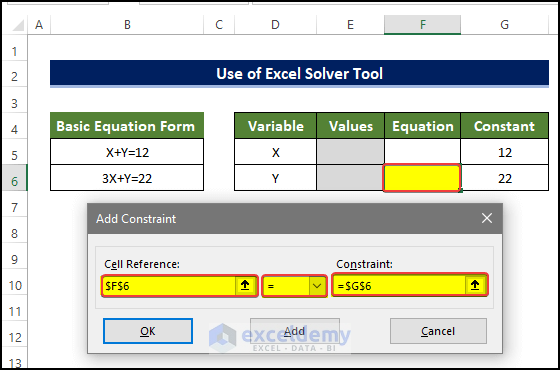
- In the Add Constraint window, select cell F6 as the cell reference and choose the Equal sign in the middle.
- Finally, select cell G6 in the constraint range box.
- Click OK after that.
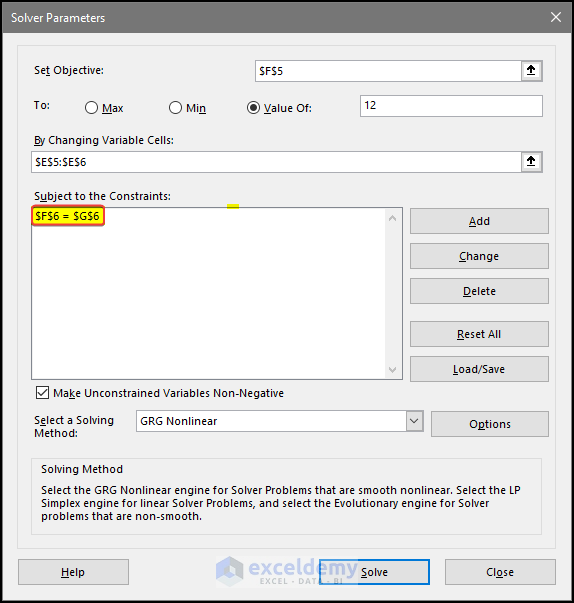
- We will go back to the previous window where we notice that the second equation is now presented.
- Click Solve after this.
- After clicking the Solve command, you will notice that the cells E5 and E6 now have the values 5 and 7 respectively.
- And this is the coordinate of the intersection of the two lines in the plot.
3. Combine INTERCEPT and SLOPE Functions for Showing Intersection in Excel Graph
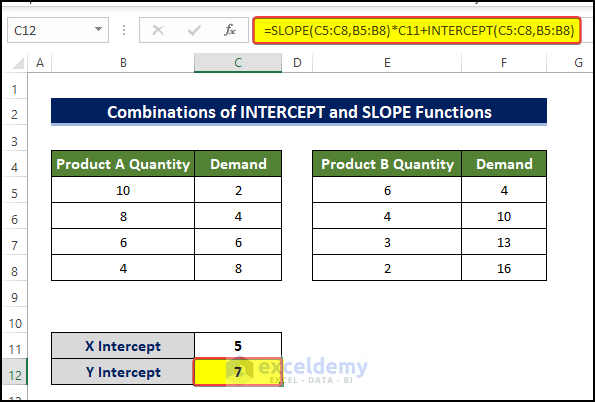
The combination of the INTERCEPT and SLOPE functions will give us the ordinate and the abscissa of the intersection point between two lines. The INTERCEPT function will estimate the distance of the intersection of the lines on the y-axis. And the SLOPE function will determine the slope between the two or more points.
Steps:
- First, we got the information about the products and their demand in a table format.
- Right after this, we will create a scatter plot with two lines from the information given above. Following the same procedure as in the first method.
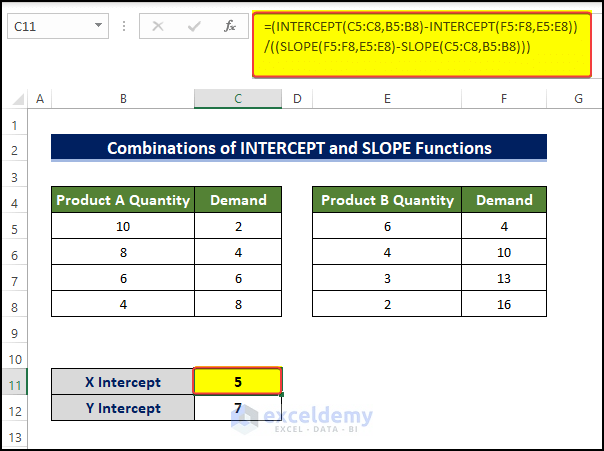
- Then select cell C11 and enter the following formula:
=(INTERCEPT(C5:C8,B5:B8)-INTERCEPT(F5:F8,E5:E8))/((SLOPE(F5:F8,E5:E8)-SLOPE(C5:C8,B5:B8)))- Therefore entering the formula, we will get the abscissa of the intersection.
🔎 Formula Breakdown
- INTERCEPT(C5:C8,B5:B8): This function will determine the interception of this line formed by these point in the first line in the Y axis.
- INTERCEPT(F5:F8,E5:E8): This function will determine the interception of this second line formed by these point in the first line in the Y axis.
- SLOPE(F5:F8,E5:E8): This function will determine the slope of the first line.
- SLOPE(C5:C8,B5:B8): This function will determine the slope of the second line.
- (INTERCEPT(C5:C8,B5:B8)-INTERCEPT(F5:F8,E5:E8))/((SLOPE(F5:F8,E5:E8)-SLOPE(C5:C8,B5:B8))): This function will return the abscissa of the intersection point between two lines.
- Then select the cell C12 and enter the following formula:
=SLOPE(C5:C8,B5:B8)*C11+INTERCEPT(C5:C8,B5:B8)
Hence entering the formula, we will get the abscissa.
🔎 Formula Breakdown
- SLOPE(C5:C8,B5:B8): This function will determine the slope of the first line.
- INTERCEPT(C5:C8,B5:B8): This function will determine the interception value of the first line in the Y axis.
- SLOPE(C5:C8,B5:B8)*C11+INTERCEPT(C5:C8,B5:B8): This function will then return the ordinate of the intersection of the two lines.
- Moreover, we can identify or add this point in this plot following previous procedures.
Download Practice Workbook
Download this practice workbook below.
Conclusion
To sum it up, the issue of how we can show intersection points between two separate lines is solved by using three separate ways. For this problem, a workbook is available to download where you can practice these methods. Feel free to ask any questions or feedback through the comment section.
Related Articles
- How to Create a Weight Loss Graph in Excel
- How to Make a Budget Constraint Graph on Excel
- How to Create Mekko/Marimekko Chart in Excel
- How to Create Activity Relationship Chart in Excel
<< Go Back to Excel Charts | Learn Excel
Get FREE Advanced Excel Exercises with Solutions!