Looking for ways to create clustered stacked column combo chart with lines in Excel? Then, this is the right place for you. Here, you will find 2 easy ways to create clustered stacked column combo charts with lines.
How to Create Clustered Stacked Column Combo Chart with Lines in Excel: 2 Ways
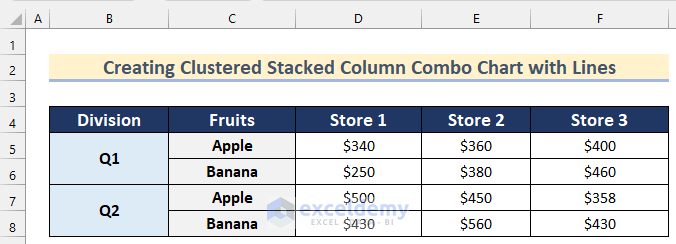
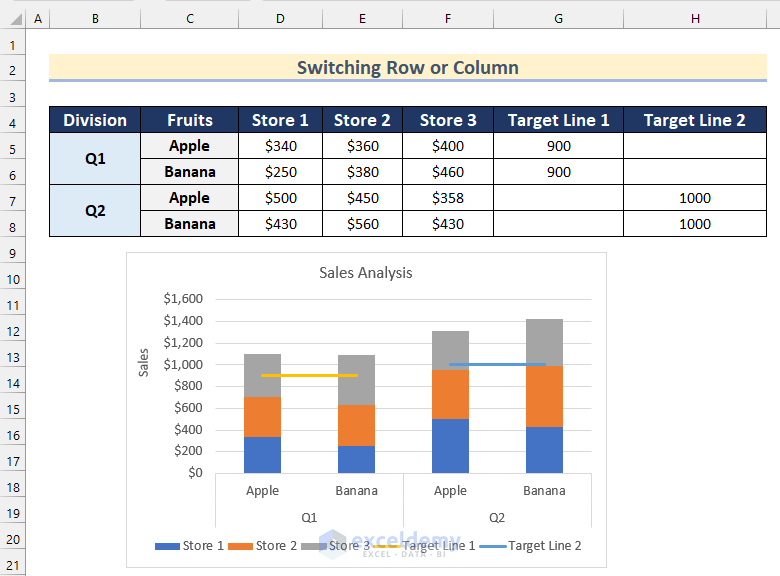
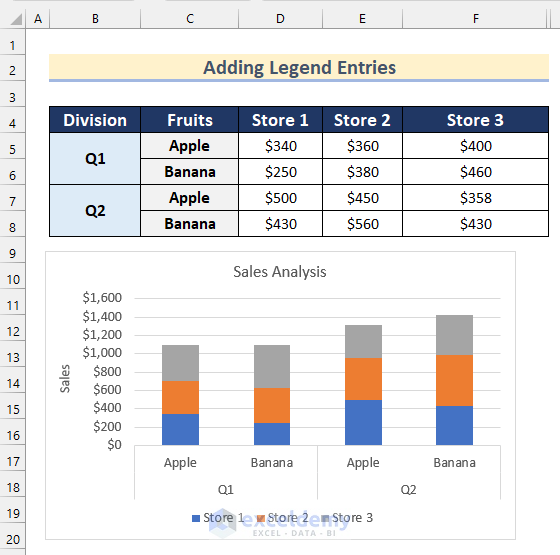
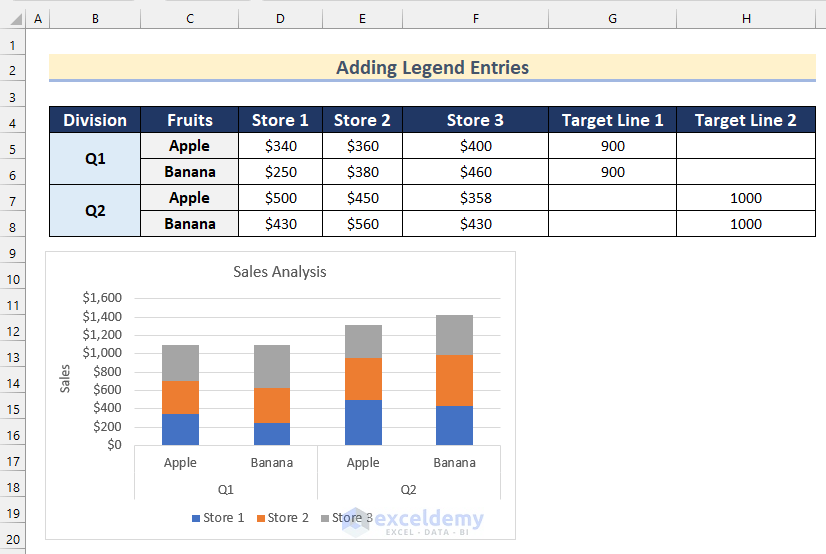
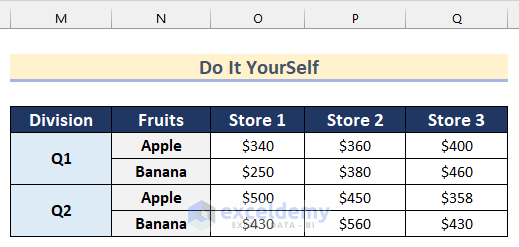
Here, we have a dataset containing the sales price of 3 Stores having 2 types of Fruits in 2 Divisions. Now, we will show you how you can create a clustered stacked column combo chart with lines in Excel.
1. Switch Row/Column to Make Combo of Clustered & Stacked Column Charts Including Lines
In the first method, we will use the Switch Row/Column feature to make a clustered stacked column chart including lines in Excel. To do that, follow the steps given below.
Step 1: Creating Clustered Column Chart
Firstly, we will show you how to create a clustered column chart in Excel.
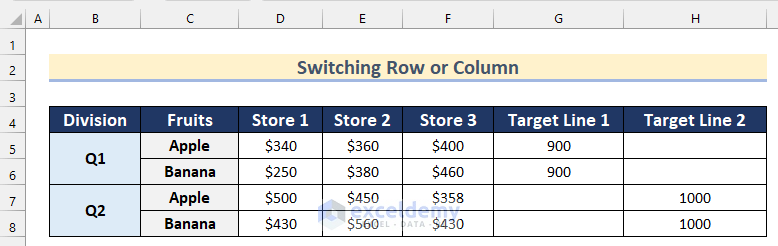
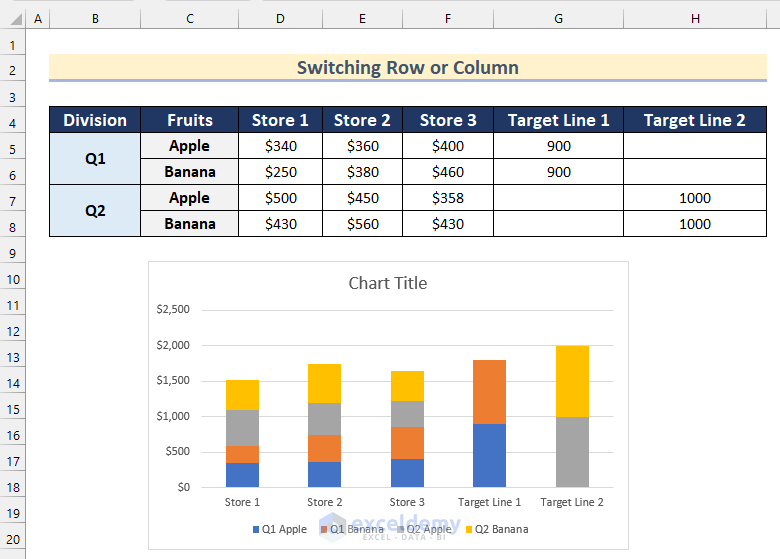
- To start, add 2 columns containing the values for the lines you want to add to the chart. Here, we added 2 columns named Target Line 1 and Target Line 2.
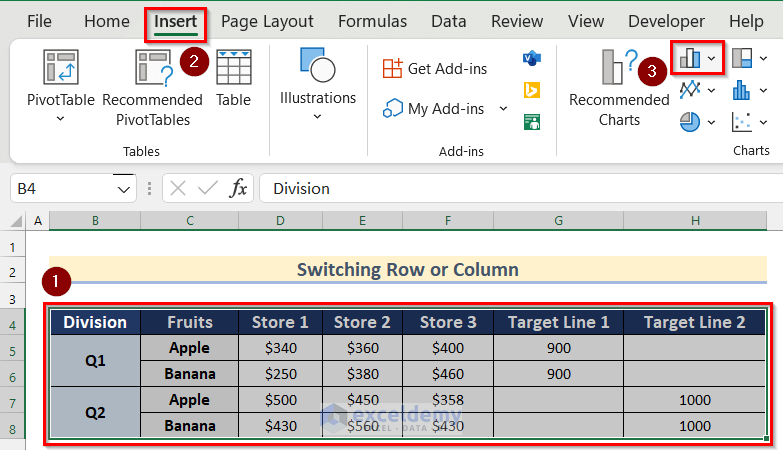
- Then, select cell range B4:H8.
- Next, go to the Insert tab >> click on Insert Column or Bar Chart.
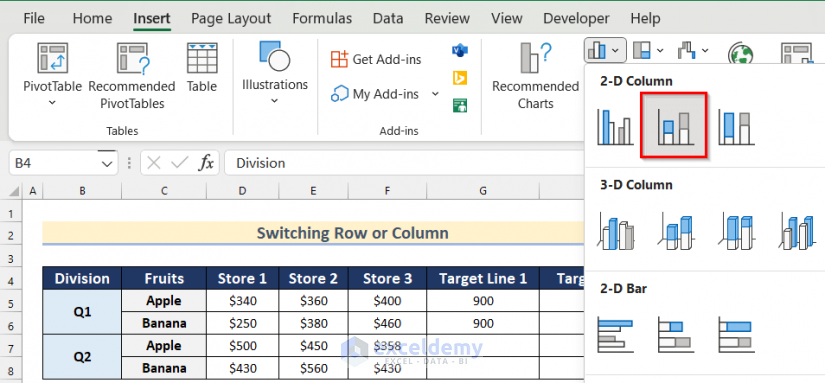
- After that, select Stacked Column.
- Finally, you will get a chart like an image given below.
Read More: How to Create a Combination Chart in Excel
Step 2: Switch Row/Column
Next, we will use the Switch Row/Column feature to create a clustered stacked column combo chart.
- Firstly, select the chart.
- Then, go to the Chart Design tab >> click on Switch Row/Column.
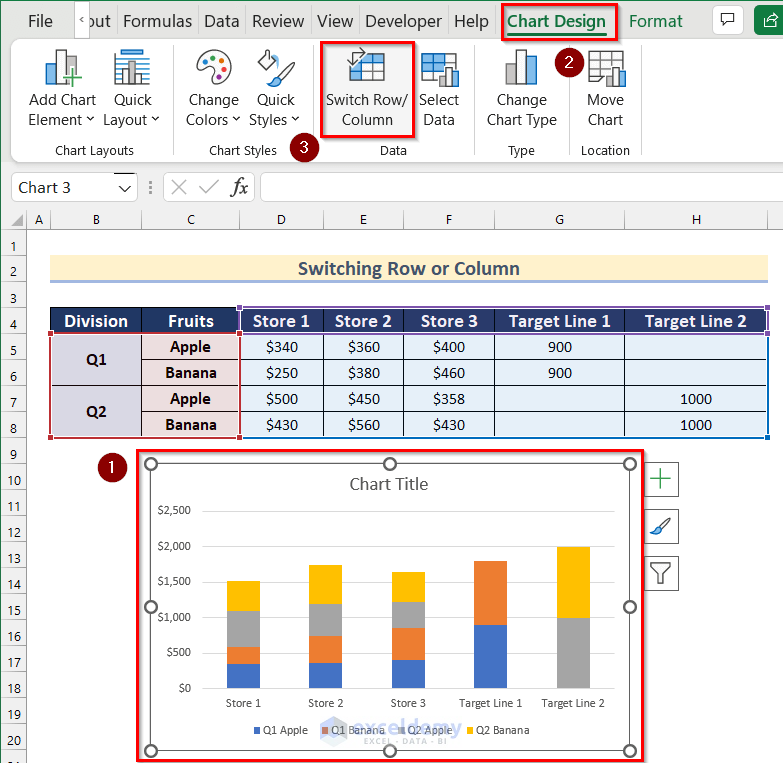
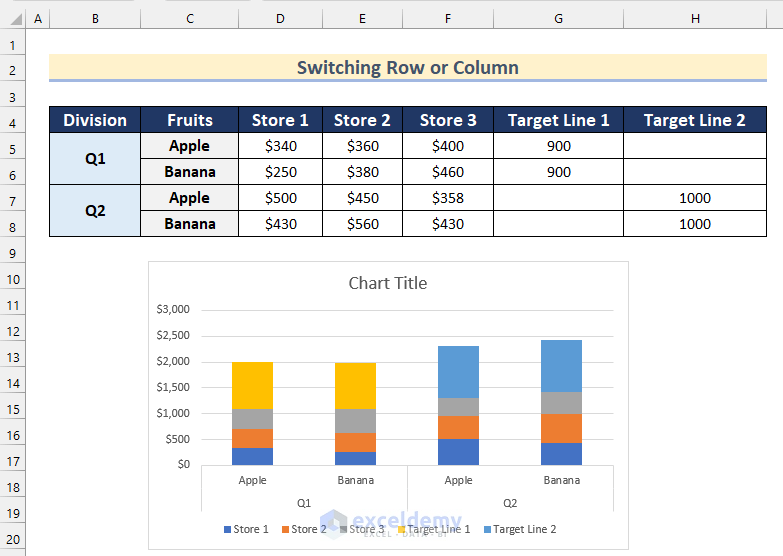
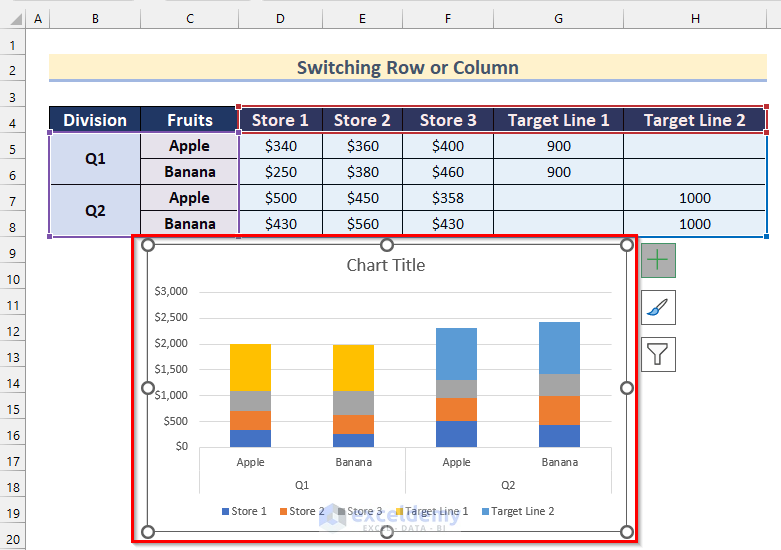
- Now, you will see that the chart has been changed accordingly.
Read More: How to Combine Two Graphs in Excel
Step 3: Series Chart Type Changing to Add Lines
Now, we will change the chart type of column Target Line 1 and 2 to add lines.
- In the beginning, select the chart and Right-click on it.
- After that, click on Change Chart Type.
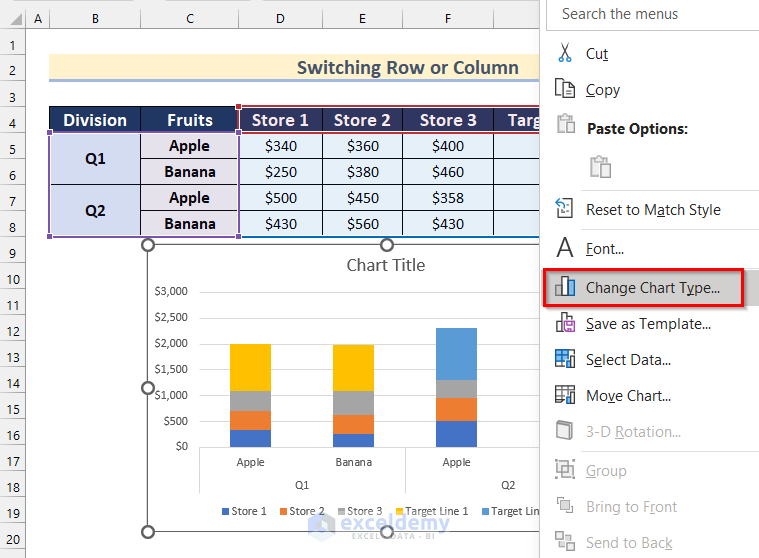
- Now, the Change Chart Type box will open.
- Then, go to the Combo option.
- Next, click on the chart options shown below under Target Line 1 and change the chart to Line.
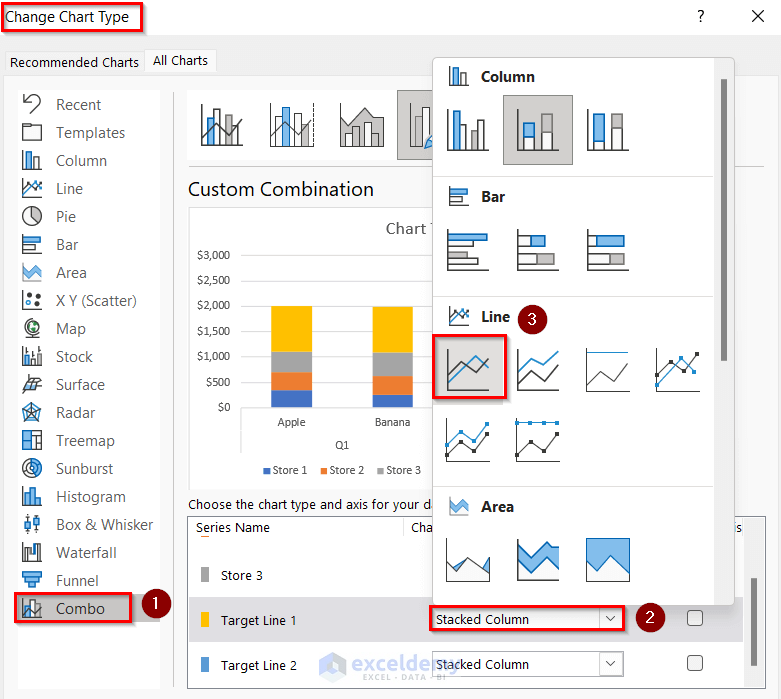
- Similarly, change the chart type for Target Line 2.

- Finally, click on OK.
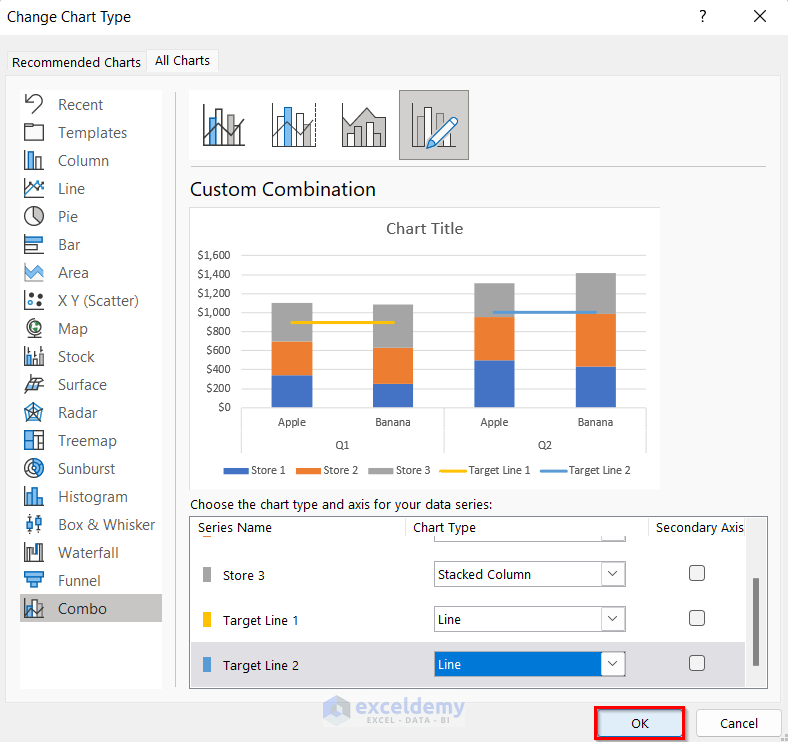
- Thus, you can add lines in a clustered stacked column combo chart in Excel.
Read More: How to Draw Target Line in Excel Graph
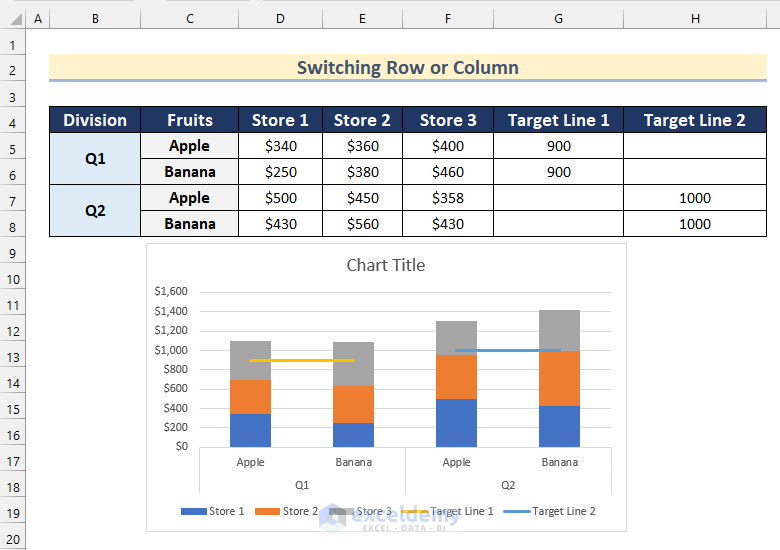
Step 4: Format Clustered Stacked Column Combo Chart
In the final step, we will format the chart that we have created.
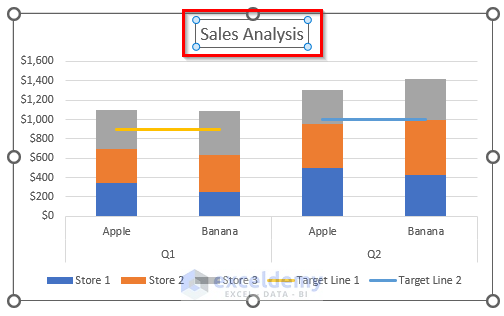
- To start with, we will change the Chart Title. To do that, select the Chart Title.
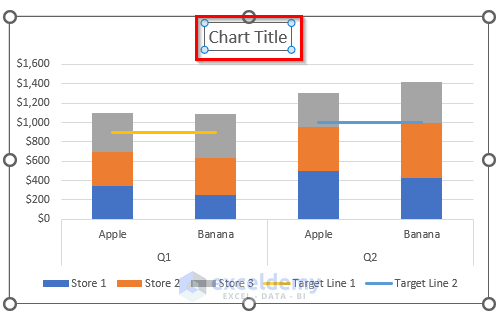
- Then, type the title you want to give to this chart. Here, we will type Sales Analysis.
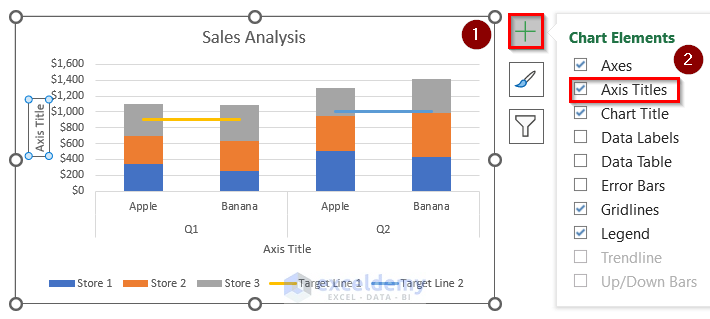
- Further, click on the “+” sign to open Chart Elements.
- After that, turn on Axis Titles.
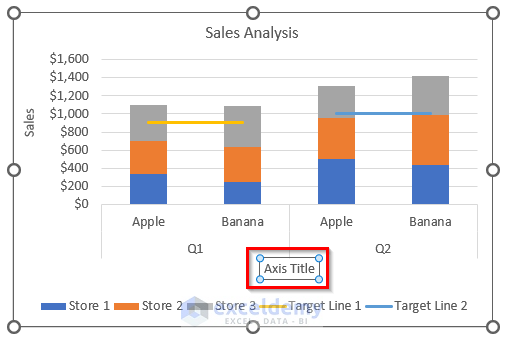
- Now, select the X-axis title.
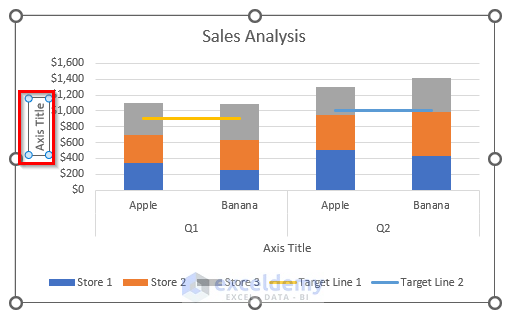
- Then, type Sales as X-axis title.
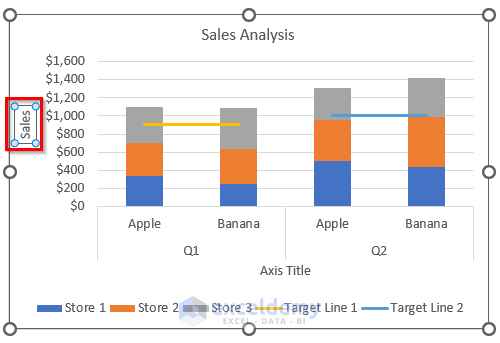
- Next, click on the Y-axis title and press Delete from your keyboard.
- Finally, you will get a clustered stacked column combo chart with lines in Excel.
Read More: How to Create Column and Line Chart Combo in Excel
2. Add Legend Entries to Create Clustered Stacked Column Combo Chart with Lines in Excel
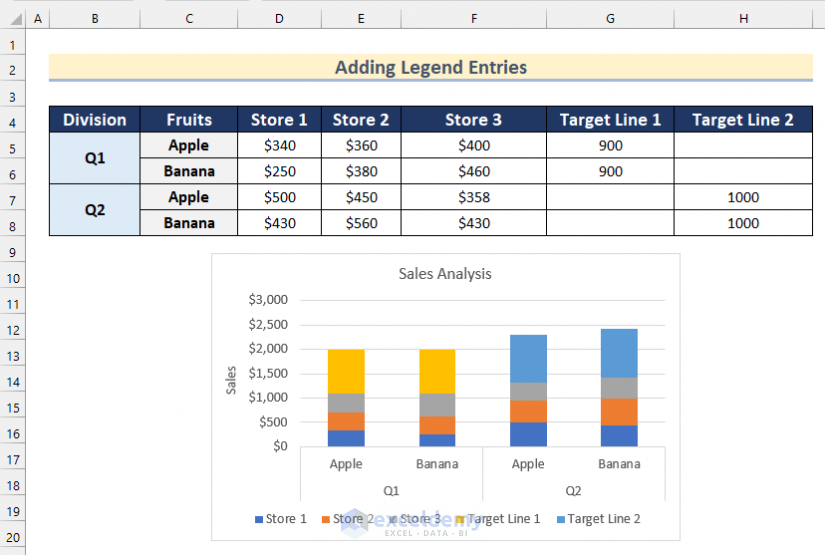
Suppose you already have a clustered stacked column combo chart like the image given below and now you want to add lines to the chart. You can do this simply by following the steps given below.
Steps:
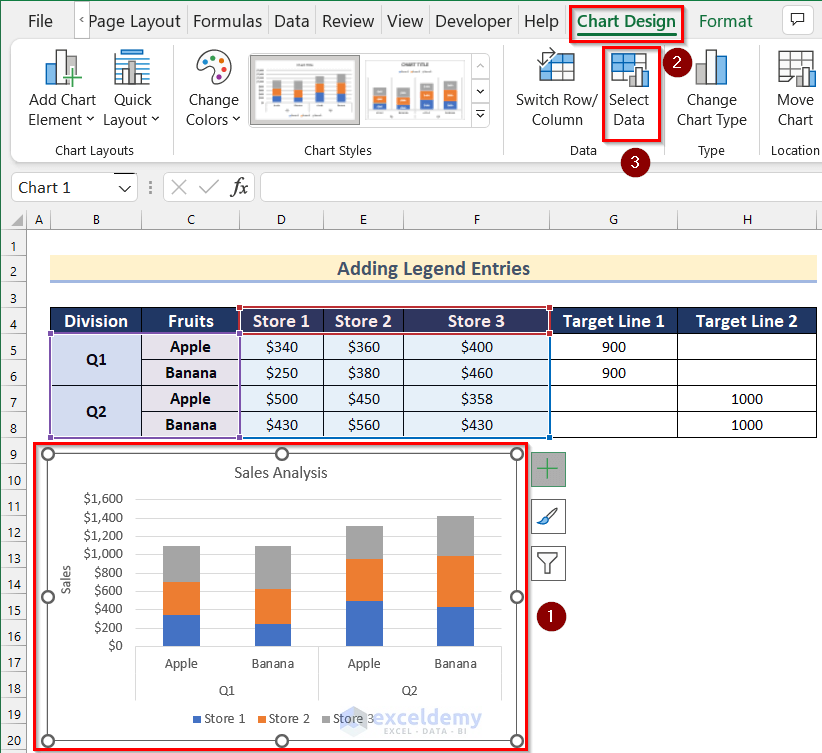
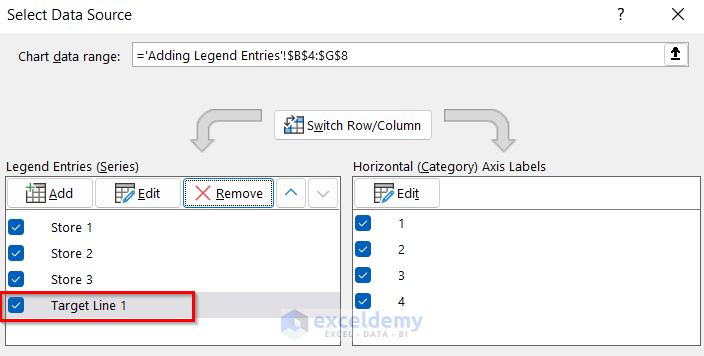
- Firstly, add 2 columns containing the values for the lines you want to add in the chart. Here, we added 2 columns named Target Line 1 and Target Line 2.
- Next, select the chart.
- After that, go to the Chart Design tab >> click on Select Data.
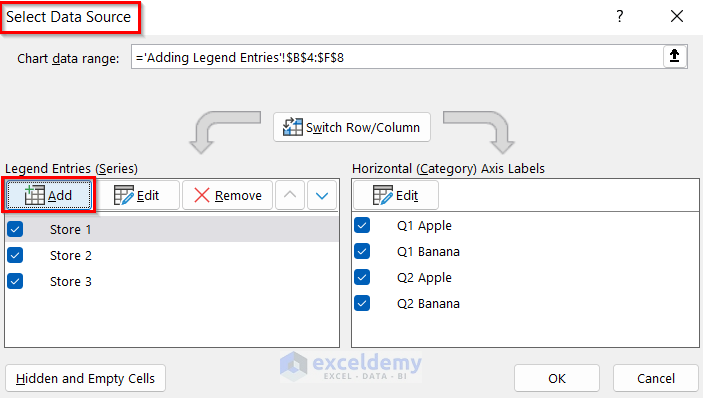
- Now, the Select Data Source box will open.
- Then, click on Add.
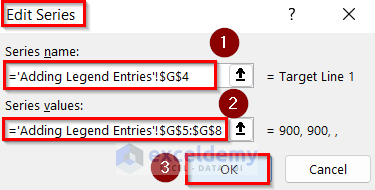
- Next, the Edit Series box will appear.
- Afterward, insert Cell G4 as the Series name and cell range G5:G8 as the Series value.
- Further, click on OK.
- Thus, Target Line 1 series will be added to the Legend Entries box.
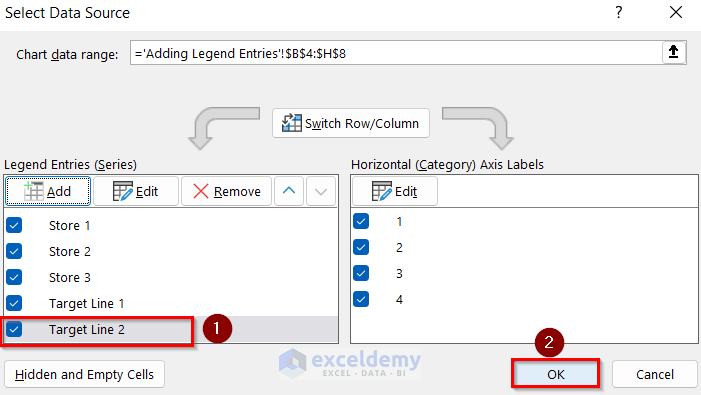
- Similarly, add Target Line 2 and then press OK.
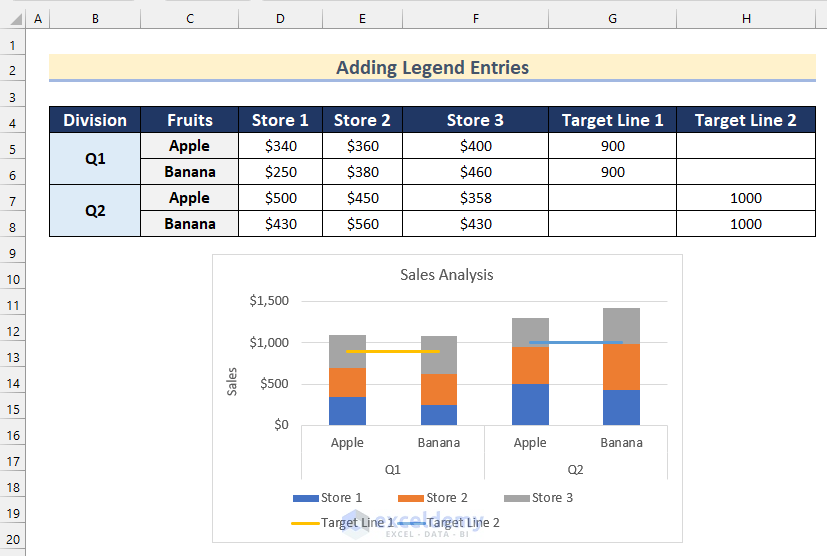
- After that, the chart will add the values in Target Line 1 and 2 columns like the image shown below.
- Finally, change the chart type of this 2 series by going through the same steps shown in Method 1.
Read More: How to Draw a Horizontal Line in Excel Graph
Practice Section
In the article, you will find an Excel workbook like the image given below to practice on your own.
Download Practice Workbook
You can download the workbook to practice yourself.
Conclusion
So, in this article, we have shown you 2 ways to create clustered stacked column combo charts with lines in Excel. I hope you found this article interesting and helpful. If something seems difficult to understand, please leave a comment. Please let us know if there are any more alternatives that we may have missed. Thank you!
Related Articles
- How to Add a Marker Line in Excel Graph
- How to Shade Area Between Two Lines in a Chart in Excel
- How to Make a Forest Plot in Excel
<< Go Back to Excel Combo Chart | Excel Charts | Learn Excel
Get FREE Advanced Excel Exercises with Solutions!
