Method 1 – Manual Approach to Calculate Cumulative Frequency & Determining the Cumulative Frequency Percentage
Steps:
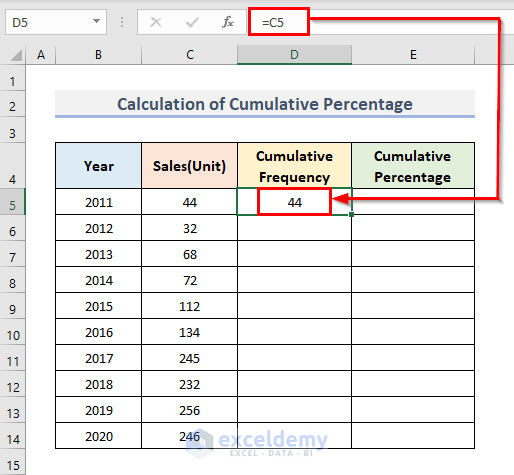
- Select Cell D5.
- Tap on Cell C5.
- Press Enter.
You’ve just defined the starting point in Cell D5 to calculate cumulative frequency.
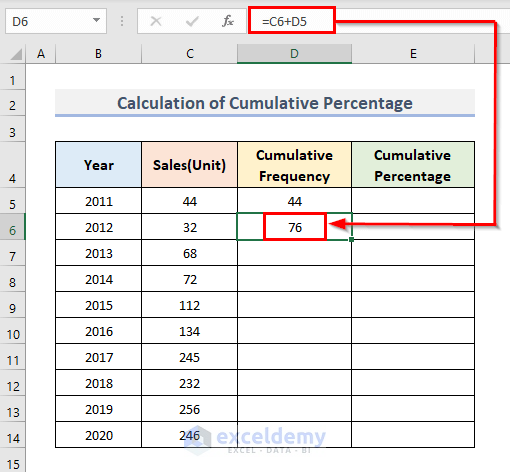
- Go to cell D6.
- Add C6 with D5. So, we need to write the formula.
=C6+D5- Press the Enter key.
Through this process, you’re adding the sales of 2012 & those from the previous year.
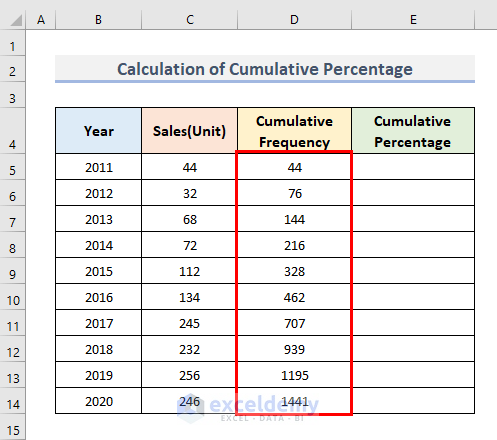
- Use the Fill Handle to drag or fill down the cell to D14.
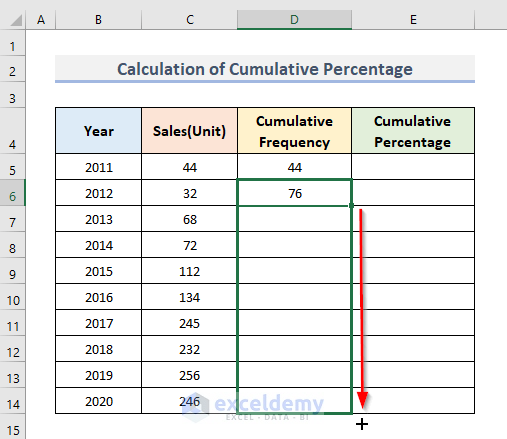
- You’ll get the cumulative sales for all years at once.
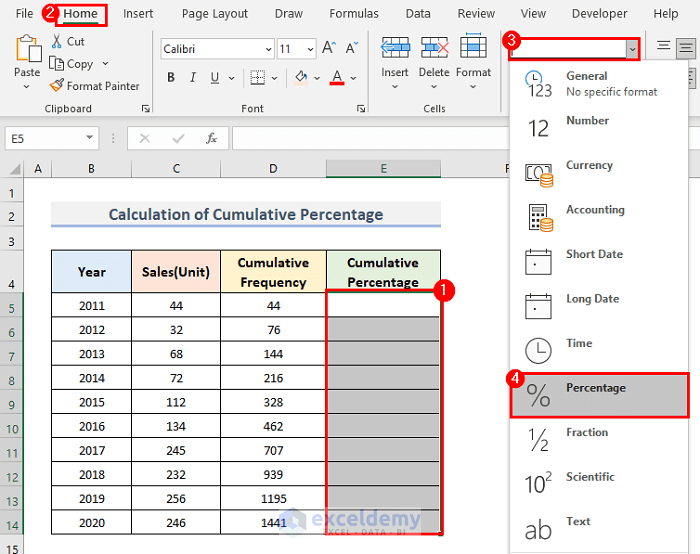
- Select the whole Column E, where you have to determine the cumulative percentages.
- Under the Home ribbon or tab, select the Percentage option from the drop-down in the Number group of commands.
- Make sure the divided values in Column E will turn into percentages.
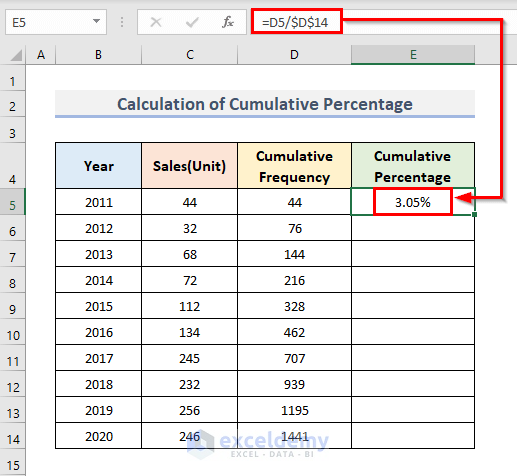
- In cell E5, divide D5(1st value from cumulative frequency) by D14(Total Sales). So, the formula will be.
=D5/$D$14
- Lock cell D14 by pressing F4 after selecting cell D14 in the Function Bar.
- Lock this cell D14; cumulative percentages will show as errors later for the rest of the cells in column E.
- If you need to be enlightened more about locking or changing Cell References then you can go here to find details on this term.
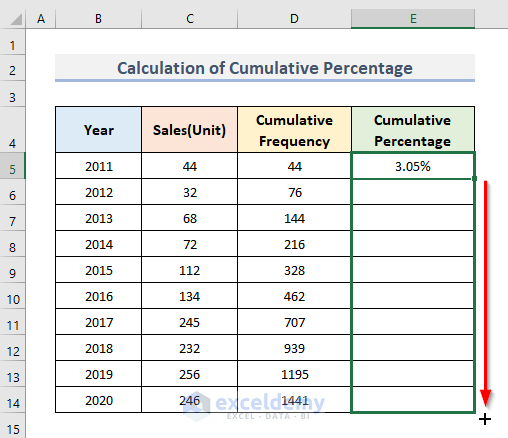
- Use the Fill Handle again to fill down cells E5 to E15.
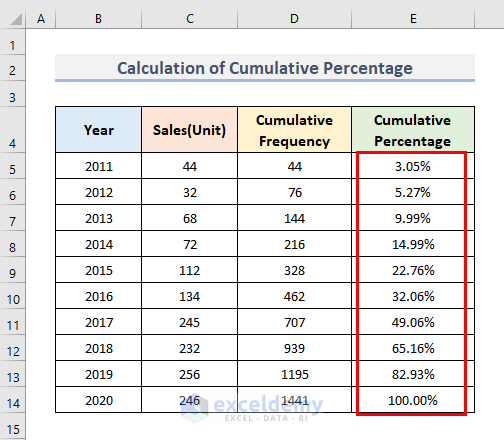
- You’ve just got the cumulative percentages for all sales year by year.
Method 2 – Apply Data Ranges or Intervals into Histogram
Steps:
- The Data Analysis command under the Data ribbon then you have to enable it first.
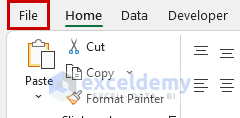
- Go to the File tab from the ribbon.
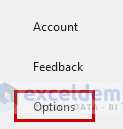
- From the File tab, go to Options.
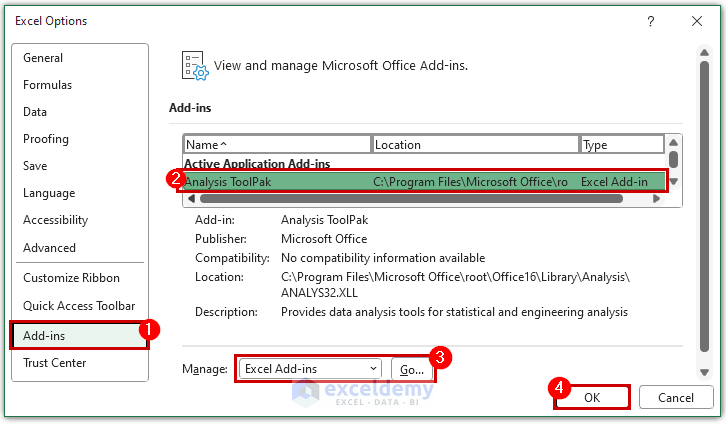
- Select Add-ins.
- Click on Analysis ToolPack, and you’ll find Excel Add-ins inside the Manage drop-down.
- Press OK.
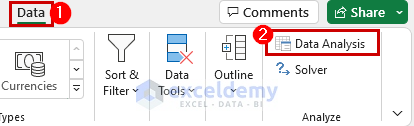
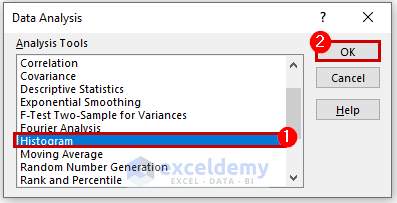
- Under the Data ribbon, select the Data Analysis command from the Analysis group of commands.
- Tap on the Histogram option and press OK.
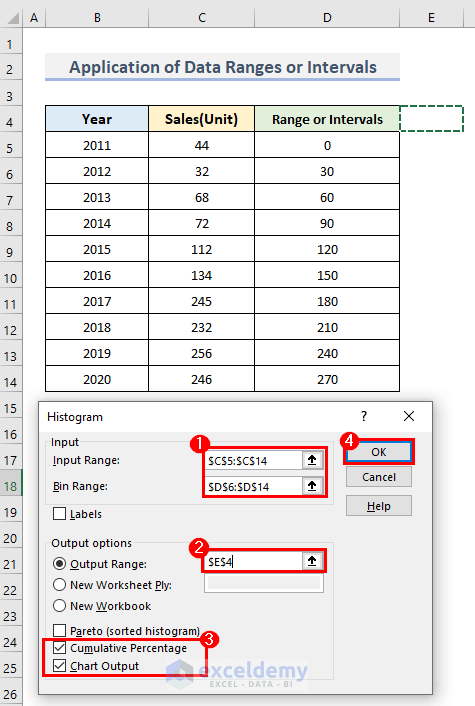
- Choose the Cell Range C5:C14 as the Input Range.
- Inside the Bin Range, input the Range or Intervals.
- Select E4 Cell as Output Range.
- Mark on Cumulative Percentage & Chart Output.
- Press OK.
- Find the Cumulative Percentages along with the Histogram Chart where you can customize the view through multiple options.
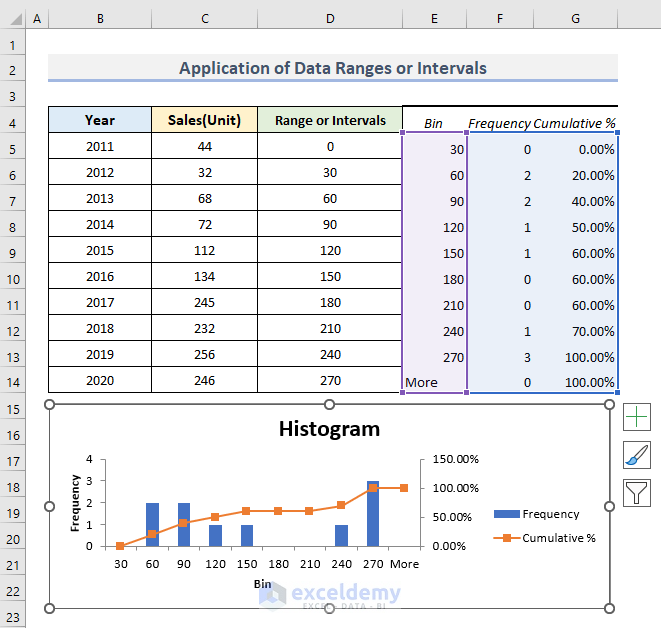
NOTE: Through this method, you won’t exactly get the cumulative sales frequency or percentages year by year, but this Histogram will show you the frequency of the sales ranges over those 10 years mentioned. You’ll know which range of your sales counts most or least in that span of years.
Method 3 – Create an Excel Pivot Table to Determine Cumulative Percentage
Steps:
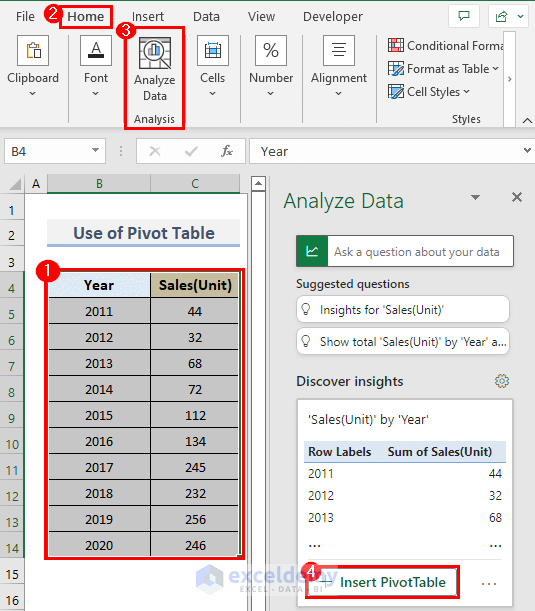
- Under the Home tab, select Analyze Data from the Analyze group of commands.
- A side window will appear like the picture below.
- Choose Insert Pivot Table.
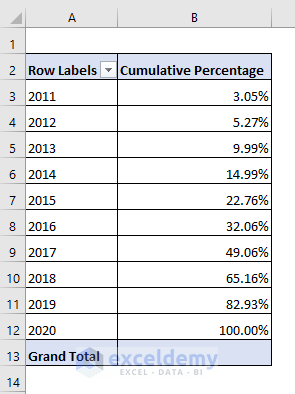
- A new spreadsheet where you’ll have the Sum of Sales by default.
- You have to find a cumulative percentage now.
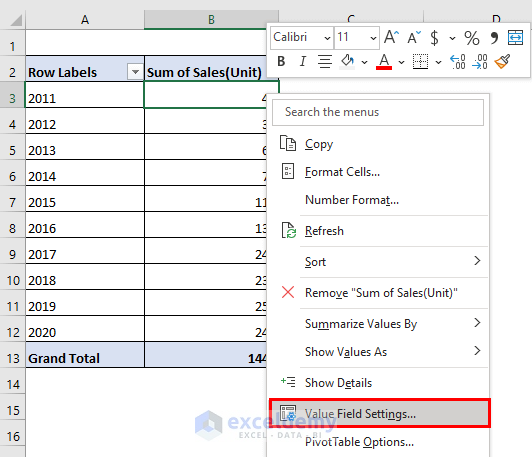
- Double-click cell B3.
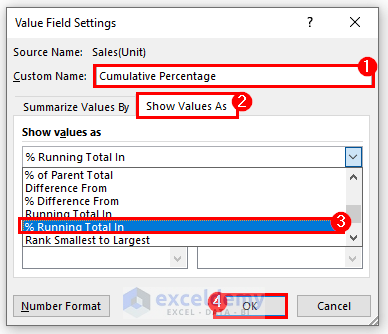
- A toolbox named Value Field Settings will appear.
- Select Show Value As the bar.
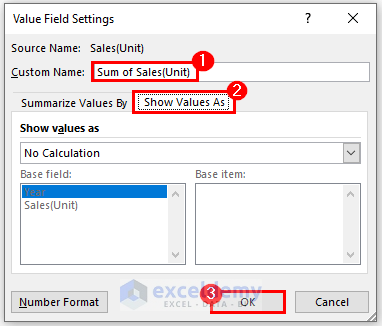
- Type ‘Cumulative Percentage’ in place of ‘Sum of Sales’ inside the Custom Name box.
- Under the Show Values As drop-down, select % Running Total In.
- Press OK.
- In Column B, the Cumulative Percentages will be shown. You’ve just transformed Unit Sales into Cumulative Percentages year by year.
Method 4 – Find out the Percentage of the Unit Values and running Total in Excel
Steps:
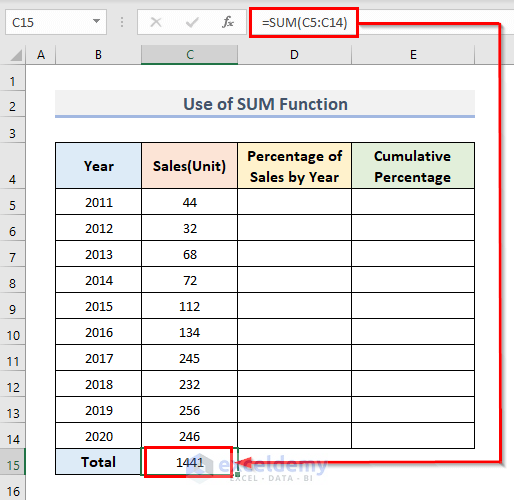
- Select cell C15.
- Add all Sales values by typing the formula.
=SUM(C5:C14)- Press Enter and you’ll get the Total Sales as 1441 Units.
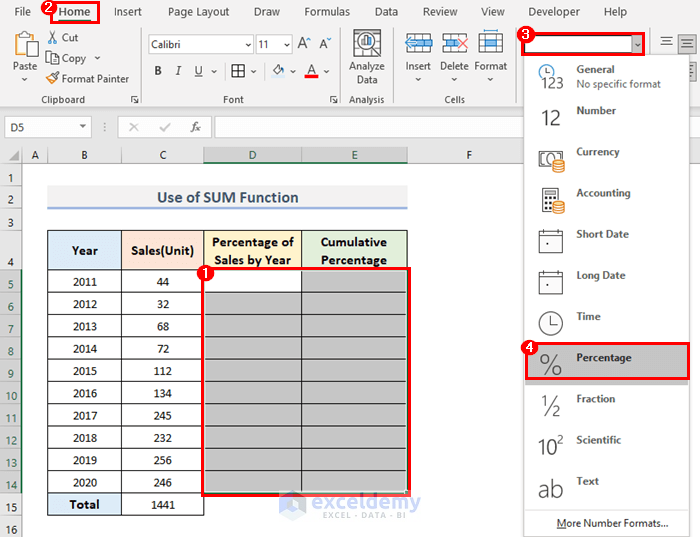
- Select Columns D & E.
- Under the Home tab, choose Percentage from the drop-down in the Number group of commands.
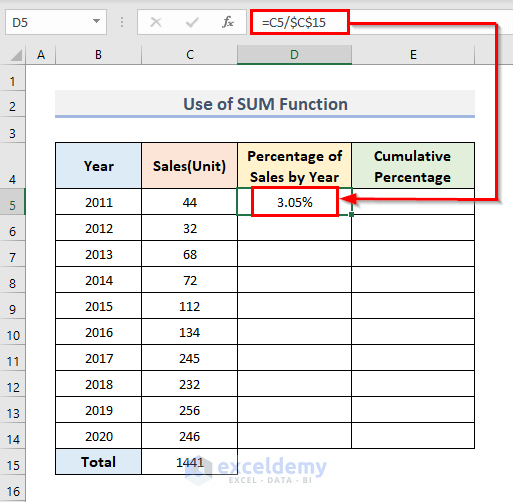
- Click on cell D5.
- Divide C5 by C15, it’ll show the result as a sales percentage in the year 2011. Type the formula.
=C5/$C$15- We locked the C15 cell by pressing F4 after typing C15, all other sales percentages will be shown as Value Error because the Sales values will be divided by empty cells consecutively under the C15 cell.
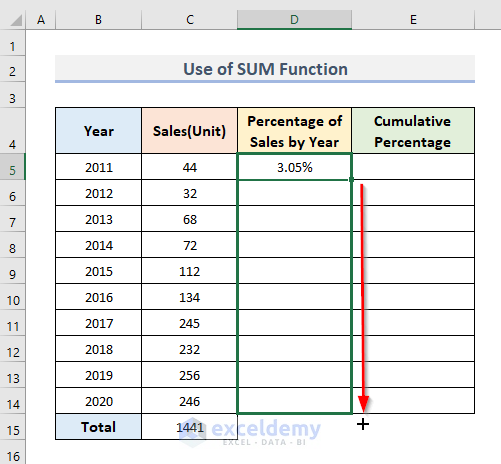
- Drag or fill down cells D5 to D14 with the Fill Handle option.
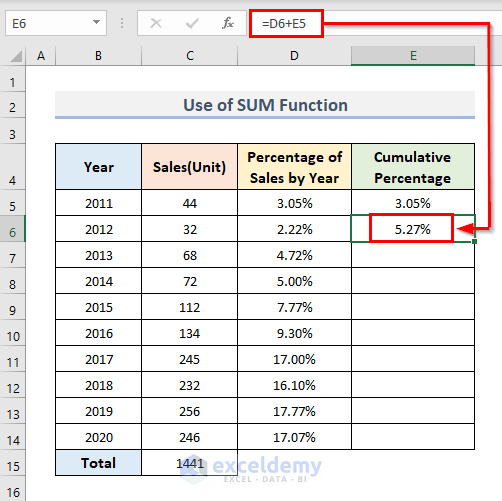
- Go to cell E5 and insert the formula down.
- The value from cell C5 will be copied.
- Select cell E5 & add D6 & E5 cells.
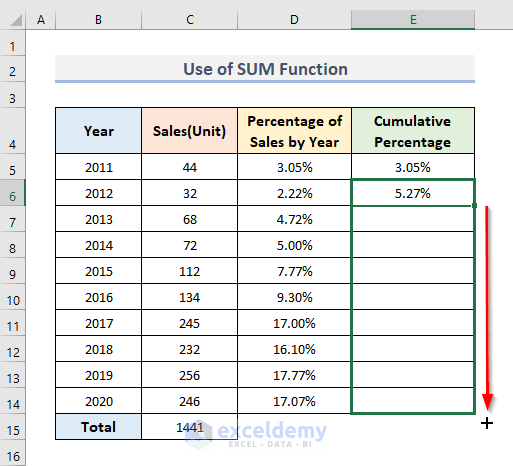
- Fill down cells E7 to E14.
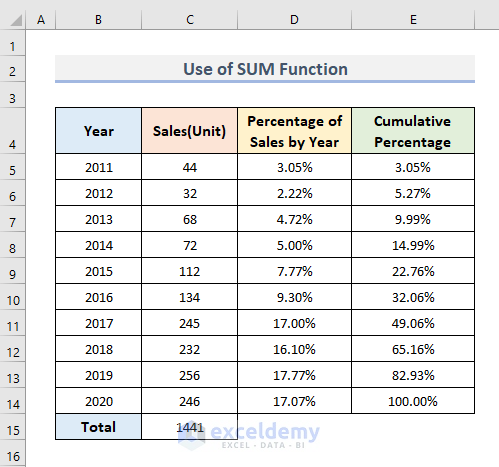
- You’ll get all cumulative percentage values right away.
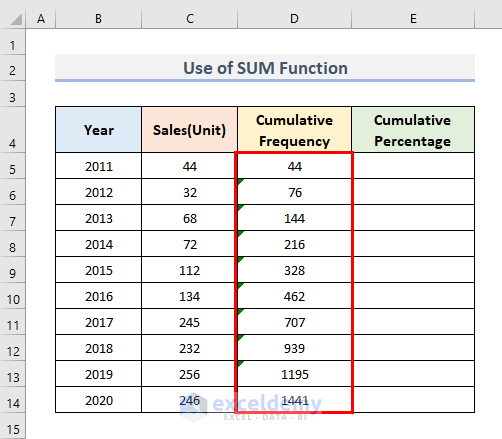
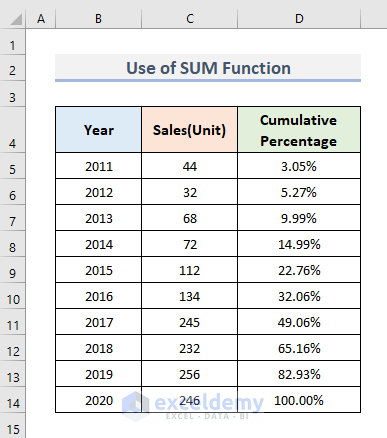
Method 5 – Use Sum Function to Compute Cumulative Frequency and Percentage
Steps:
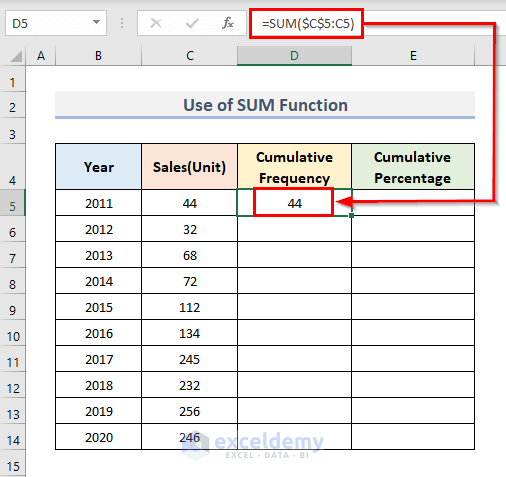
- Select cell D5 and type the formula down.
=SUM($C2$5:C5)- Press the Enter key.
- By locking C5 cell 1st, it’ll make sure each of the next cells will be added to the just previous cell when you’ll go to find the cumulative frequency of all cells in Column D in the next step.
- Use the Fill Handler in cell D5 to fill down D6:D14.
- You’ve just got the cumulative frequencies of all sales year by year.
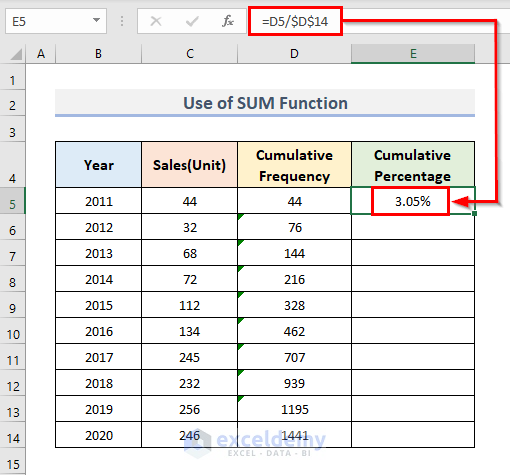
- Select cell E5 & insert the simple formula below.
=D5/$D$14- This means you’re dividing D5 by Total Sales from D14.
- You have to lock cell D14 as you’re dividing all Sales values from Column E by only D14 every time.
- Don’t forget to enable the Percentage format for Column E by choosing from the drop-down in the Number group of commands.
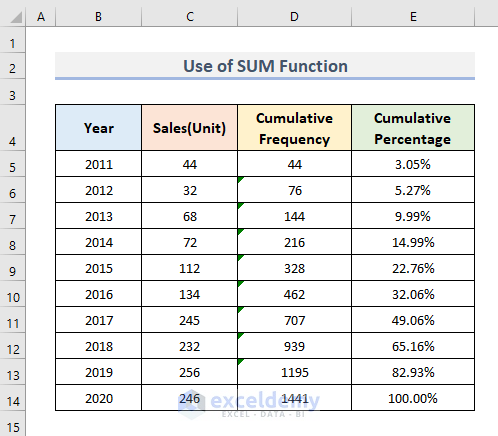
- You’ll get all cumulative percentage values.
Method 6 – Embed Immediate Formula to Calculate Cumulative Percentage in Excel
Steps:
- Select cell D5 and type the formula there.
=SUM($C$5:C5)/SUM($C$5:$C$14)- Press Enter.
- Inside the parenthesis & in the numerator part, you’re calculating the cumulative frequency of the sales values.
- The denominator is the sum of all sales values in total and as the total value won’t change for any cell in Column D; we have to make sure the cells are locked by using $ signs before both Column Names & Row Numbers.
- Use the Fill Handle to drag down Cell D5 to D14 & the entire cumulative frequency will be displayed.
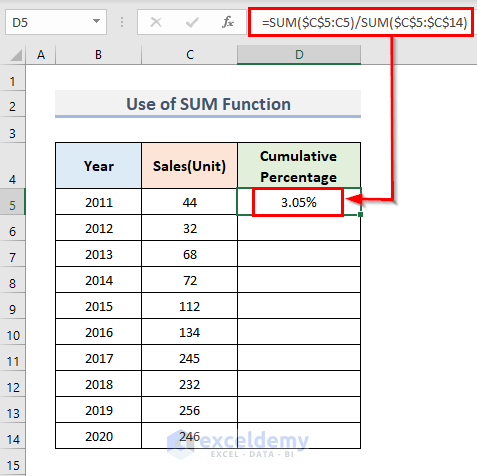
- You will get the cumulative percentage.
Download the Practice Workbook
You can download our practice worksheet below that we’ve used while preparing this article.
Related Articles
- How to Calculate Total Percentage from Multiple Percentages in Excel
- How to Calculate Percentage of Percentage in Excel
- How to Calculate Percentage Based on Conditional Formatting
- How to Calculate Percentage in Excel Based on Cell Color
- Percentage Showing as Thousand in Excel
- Why Are My Percentages Wrong in Excel?
- How to Remove Percentage in Excel
- How to Find the Percentage of Two Numbers in Excel
- How to Calculate Percentage of Month in Excel
- How to Calculate Percentage Complete Based on Dates in Excel
- How to Calculate Error Percentage in Excel
<<Go Back to Calculating Percentages in Excel | How to Calculate in Excel | Learn Excel
Get FREE Advanced Excel Exercises with Solutions!

THANKS
Hello Ichal,
You are most welcome. Thanks for your appreciation. Keep exploring Excel with Exceldemy!
Regards,
ExcelDemy