The Compa ratio is very common when it comes to business. Using this ratio, we can understand the employee’s salary range and whether we give them a proper salary structure or not. In Microsoft Excel, we can easily find out and calculate the compa ratio. This article will give you a proper guideline about how to calculate the compa ratio in Excel. I hope you enjoy the whole article and gather some valuable knowledge.
What Is Compa Ratio?
Compa ratio is the short form of compensation ratio. This ratio demonstrates the salary of the employee compared to the market salary. Compa ratio allows the employees to know about their position. It denotes whether employees get competitive salaries or below the average market salary. When someone gets a lower-than-average market salary, he/she may have a tendency to switch jobs. The company may lose a potential candidate for salary issues.
Why Do Businesses Use Compa Ratio?
When you want to maintain a good business, you have to take the best talents. To attract them, you have to offer competitive salaries otherwise there is reason to work in your company with dedication. Many companies use the compa ratio to know where they lag behind other companies. Compa ratio will explain the details about how to connect the best talents and also how to maintain the business structure. You can’t give more salary to make employees happy without altering the profit. On the other hand, you can’t take all the profit without giving a competitive packet to your employees. The Compa ratio will help to adjust those things and give you a perfect solution. One of the prime reasons why the employee leaves the company for a better future is basically the salary structure. You can give someone a lower salary than midpoint but you have to adjust them with other benefits. In a company, salary can vary from person to person based on their performance and experience. To recruit the best talents, you have to maintain all the things where the compa ratio plays a vital role.
Types of Compa Ratio
When it comes to the Compa ratio, it has three types. All of them are very useful for a specific purpose. The Compa ratio consists of the individual compa ratio, average compa ratio, and group compa ratio.
Individual Compa Ratio
This is the most common type of compa ratio where the Compa ratio is calculated by the ratio of the individual basic salary and midpoint salary of that job title.

This will denote whether the individual gets a competitive salary or not. Here, compa ratio 1 means the individual gets a similar salary compared to the market value of the job. A compa ratio of less than 1 means that he/she gets a lower salary compared to the market of the job. Again the compa ratio of more than 1 means the individual gets more than compared to the midpoint salary of that job.
Average Compa Ratio
The next type of compa ratio is known as the average compa ratio. Sometimes, the company gives better salaries to some employees for their performance and experience. To adjust this salary structure, they offer a lower salary to some individuals who have less experience. The average compa ratio comes from this concept. To calculate the average compa ratio, we need to take a ratio of all the individual compa ratios and the total number of individuals.

Group Compa-Ratio
Finally, another important compa ratio is the group compa ratio. Every company has a salary budget for a particular group. Using the group compa-ratio, they can easily find out the condition of their group budget. The group compa ratio can be calculated as a ratio of the sum of the individual salaries and the sum of the midpoint of that group.

How to Calculate Compa Ratio in Excel: 3 Suitable Examples
To calculate the Compa ratio, we find three suitable examples through which you can get a clear idea about the Compa ratio. All of these examples are very useful in any business company. They can prepare future plans using these compa ratios.
1. Calculate Individual Compa Ratio in Excel
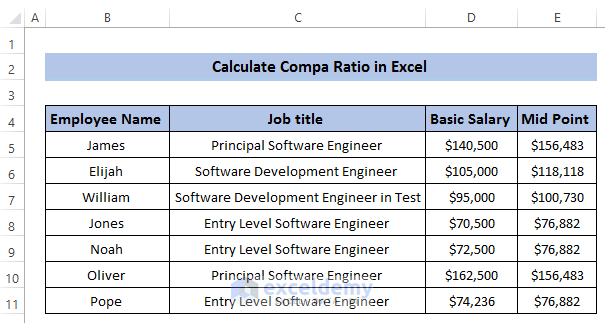
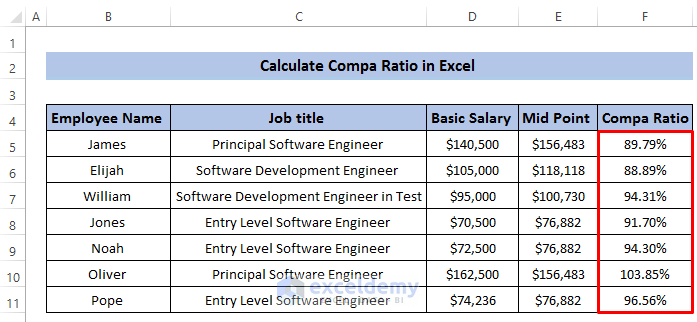
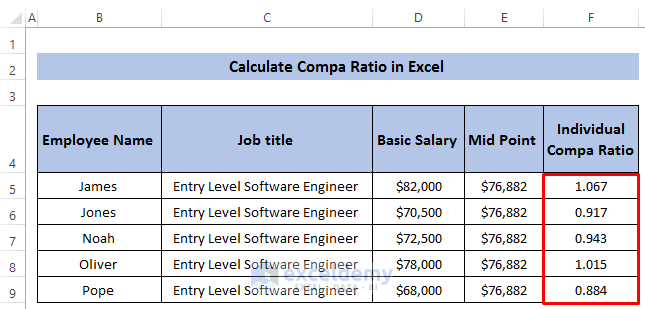
When you calculate the Compa ratio in our company, it is very basic to use the individual Compa ratio. This Compa ratio mainly focuses on individual employees and compares their salary with the market salary on that particular job post. To show the Compa ratio, we take a dataset that includes some employees, their job positions, basic salaries, and midpoint salaries by market research.
Now, follow the following steps to calculate the individual compa ratio.
Steps
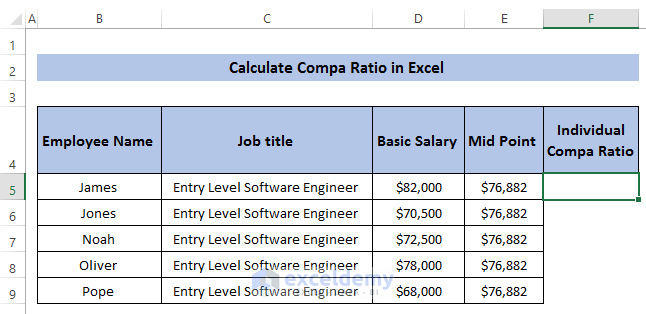
- First, select cell F5.

- As we know individual compa ratio is the ratio of the basic salary of an individual and the midpoint salary of that job post in the market.
- Next, write down the following formula in the formula box.
=D5/E5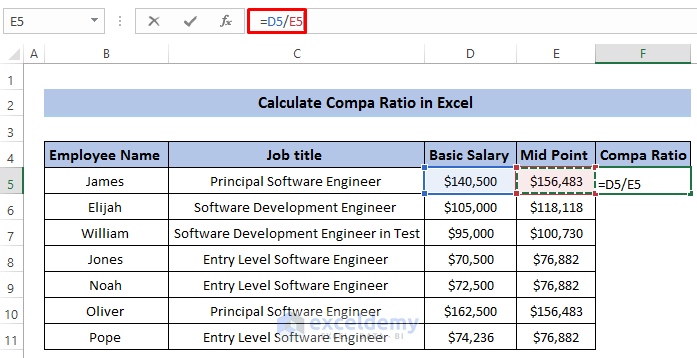
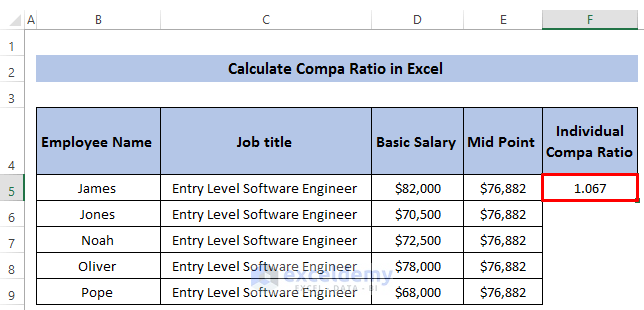
- Then, press Enter to apply the formula.

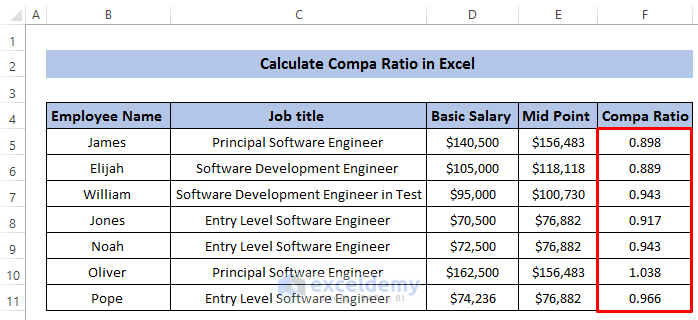
- Next, drag the Fill handle icon down the column.
- Now, you can express the compa ratio in percentage. To do this first the range of cells from F5 to F11.

- Next, go to the Home tab in the ribbon.
- From the Number group, select the Number. See the screenshot.
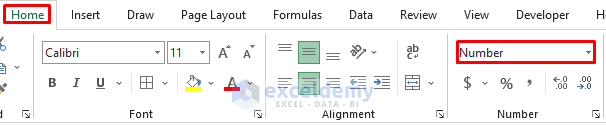
- Several options will appear.
- From there, select Percentage.

- Finally, after clicking on the Percentage, all the compa ratios will be expressed in percentages.
Read More: How to Calculate Sortino Ratio in Excel
2. Calculate Average Compa Ratio in Excel
Secondly, you can calculate the average compa ratio in Excel. The average compa ratio is mainly based on all the individual compa ratios. To do this, follow the following steps carefully. In this example, we will use the SUM function.
Steps
- First of all, we can some entry-level software engineers’ data.
- Before calculating the average compa ratio in Excel, we need to calculate the individual compa ratio of that group.
- Next, select cell F5.
- Then, write down the following formula in the formula box
=D5/E5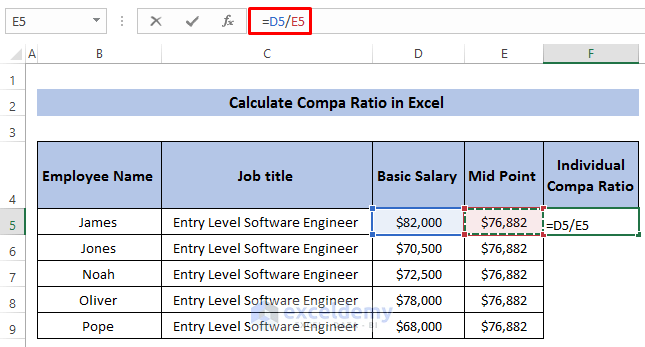
- Press Enter to apply the formula.
- Next, drag the Fill handle icon down the column.
- As we know the average compa ratio is calculated using the individual compa ratio. So, we have to utilize these individual compa ratios.
- As we get a single compa ratio, we need to merge the cells.
- Select the range of cells G5 to G9.

- Then, go to the Home tab in the ribbon.
- In the Alignment group, select Merge & Center.

- It will create a merged cell.

- Next, select the merged cell.
- As we know the average compa ratio is the ratio of the sum of the individual compa ratio and the total number of individuals.
- Write down the following formula in the formula box.
=SUM(F5:F9)/5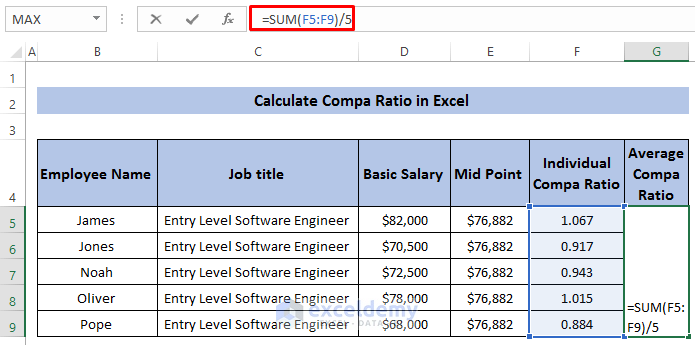
- Finally, press Enter to apply the formula.
Read More: How to Calculate Ratio of 3 Numbers in Excel
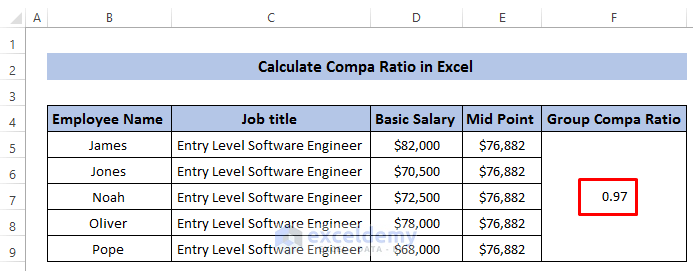
3. Calculate Group Compa Ratio in Excel
Our last example is based on the group compa-ratio in Excel. This concept mainly appears in terms of budget purposes. Every company must have a limited budget for a certain group of people. The group compa- ratio helps to understand whether the budget is good enough or not. In this example, we will use the SUM function.
Steps
- Here, we take a group of employees who work as entry-level software engineers.
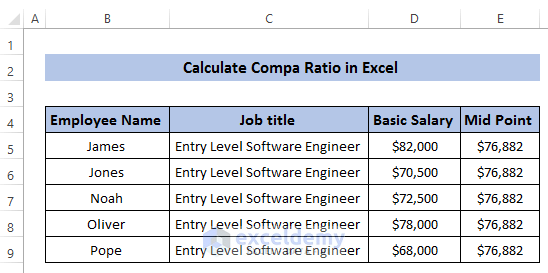
- As we know, group compa-ratio provides a ratio for the whole group.
- So, merge the range of cells from F5 to F9 just like the average compa ratio.
- Next, select the merged range of cells.

- Then, write down the following formula in the formula box.
=SUM(D5:D9)/SUM(E5:E9)
- Next, press Enter to apply the formula.
Read More: How to Calculate Sharpe Ratio in Excel
How to Interpret Compa Ratio
The Compa ratio is a powerful process to compare the competitiveness of any individual. It also helps to perform group-wise where you can see whether they meet the target budget or not. We have a dataset that includes some entry-level software engineers. We have calculated individual, average, and group compa ratios.
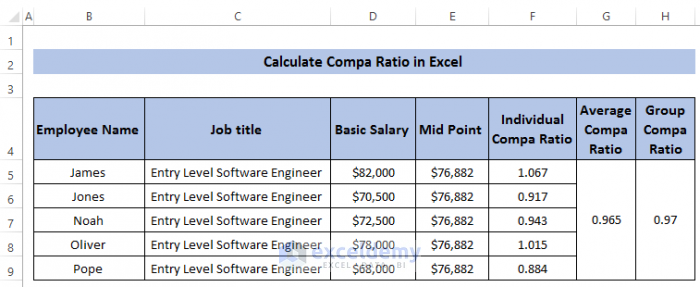
Here, we are interpreting the compa ratio from the previous three examples:
- For the individual compa ratio, the ratio varies from 0.884 to 1.067. It denotes some of the employees get less than the mid-point salary of the job post and some of them get more than mid-point salary. The mid-point is calculated from the market research from a particular job post. You may think employees will switch jobs if they get less competitive salaries. But companies are careful enough, even if they give a less basic salary, they will adjust it with other benefits. Otherwise, the company will lose valuable employees easily.
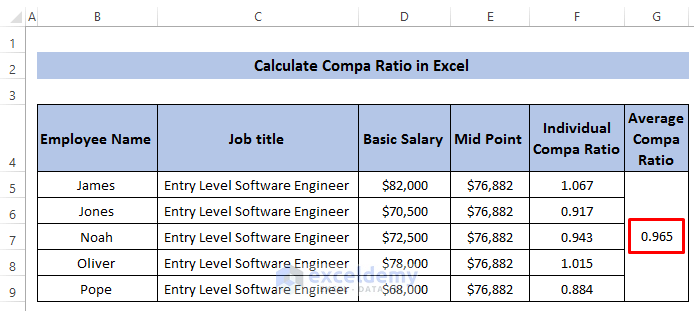
- For the average compa ratio, they create a compa ratio for a specific group. In a group, some of them earn less and some of them earn more. The average compa ratio will adjust the overall salary for a particular group. Here, the average compa ratio is 965 which is close to 1. The basic difference between average and group compa ratio is that average compa ratio can be calculated for different job sizes whereas group can be done only in a department.
- The group compa ratio will basically compare the salary of any department of the organization. That’s why it takes all the employee’s salaries and Midpoint salaries. Here, the group compa ratio is 97 which is close to 1 which means it will not exceed the budget for this department.
Things to Remember
In terms of the average compa ratio and group compa ratio, you may think they are similar. But it is actually not true. You can use the average compa ratio utilizing the individual compa ratio for different departments of a company whereas the group compa ratio must be calculated for a specific department.
Download Practice Workbook
Conclusion
We have shown three different examples through which you can calculate the compa ratio in Excel. We have also discussed the details of the compa ratio and its basic advantages. I hope you have a better understanding of the compa ratio from now on. If you have any questions, feel free to ask in the comment box.
Related Articles
- How to Calculate Average Ratio in Excel
- How to Calculate Male Female Ratio in Excel
- How to Calculate Odds Ratio in Excel
- How to Calculate Current Ratio in Excel
<< Go Back to Ratio in Excel | Calculate in Excel | Learn Excel
Get FREE Advanced Excel Exercises with Solutions!
