Understanding Odds Ratio (OR)
- The Odds Ratio (OR) represents the likelihood of an event occurring in one group compared to another group.
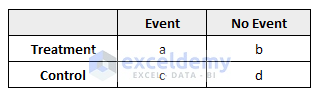
- Specifically, it’s the ratio of the odds of an event happening in the treatment group (a/b) to the odds of the same event happening in the control group (c/d).
Generic Formula for Odds Ratio
- The odds ratio can be expressed as:
Odds Ratio = (a/b)/(c/d) = (a×d)/(b×c)
Example Dataset
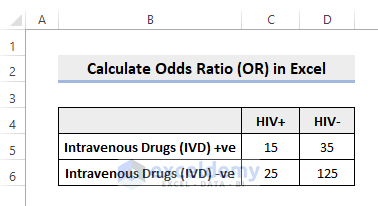
Let’s consider a medical survey with the following data:
- Treatment group (IV drug users):
- HIV+: a cases
- HIV-: b cases
- Control group (non-drug users):
- HIV+: c cases
- HIV-: d cases
Calculating Odds Ratio in Excel
- Suppose the data is in cells C5 (HIV+ in drug users) through D6 (HIV- in non-drug users).
- To calculate the odds ratio, enter the following formula in cell E5:
=(C5/D5)/(C6/D6)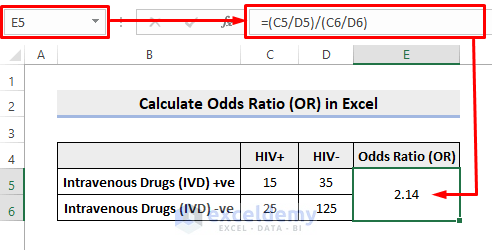
Interpretation:
The result (e.g., 2.14) indicates that those who are HIV+ are 2.14 times more likely to also be IV drug users than to be non-drug users.
Read More: How to Calculate Ratio of 3 Numbers in Excel
Confidence Intervals (CI) for Odds Ratio
- Confidence intervals provide a range of values within which the true odds ratio likely falls.
- The generic formula for the 95% confidence interval is:
Confidence Interval = e^(ln(OR)±1.96×√(1/a+1/b+1/c+1/d))
- To calculate the lower 95% confidence interval, use this formula in cell F5:
=EXP(LN(E5)-1.96*SQRT(1/C5+1/D5+1/C6+1/D6))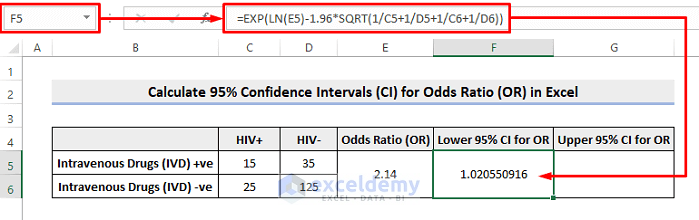
- For the upper 95% confidence interval, use this formula in cell G5:
=EXP(LN(E5)+1.96*SQRT(1/C5+1/D5+1/C6+1/D6))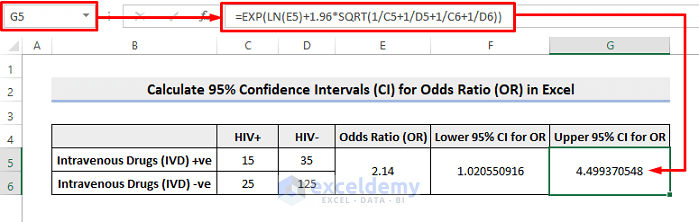
Interpreting Results
- Remember that an OR > 1 generally indicates a higher likelihood of the event occurring.
- An OR < 1 suggests the opposite.
- Avoid concluding that IV drug users are 2.14 times more likely to become HIV+; instead, interpret it the other way around.
Download Practice Workbook
You can download the practice workbook from here:
Related Articles
- How to Calculate Average Ratio in Excel
- How to Calculate Male Female Ratio in Excel
- How to Calculate Sortino Ratio in Excel
- How to Calculate Sharpe Ratio in Excel
- How to Calculate Compa Ratio in Excel
<< Go Back to Ratio in Excel | Calculate in Excel | Learn Excel
Get FREE Advanced Excel Exercises with Solutions!
