What Is a One Way/Variable Data Table? In a one-variable data table, a single cell is the input in the data table. The following figure shows the ...
In the following dataset, we have a two-variable what-if analysis on a direct mail profit model. One variable is the response rate, which varies ...
How to Open the Excel Watch Window For example, there are 83 rows (of data) in this worksheet. The 83rd row shows the total sales amount. You may ...
Excel can handle much-sophisticated models than the preceding example. To perform a what-if analysis using Excel, you have three basic options: ...
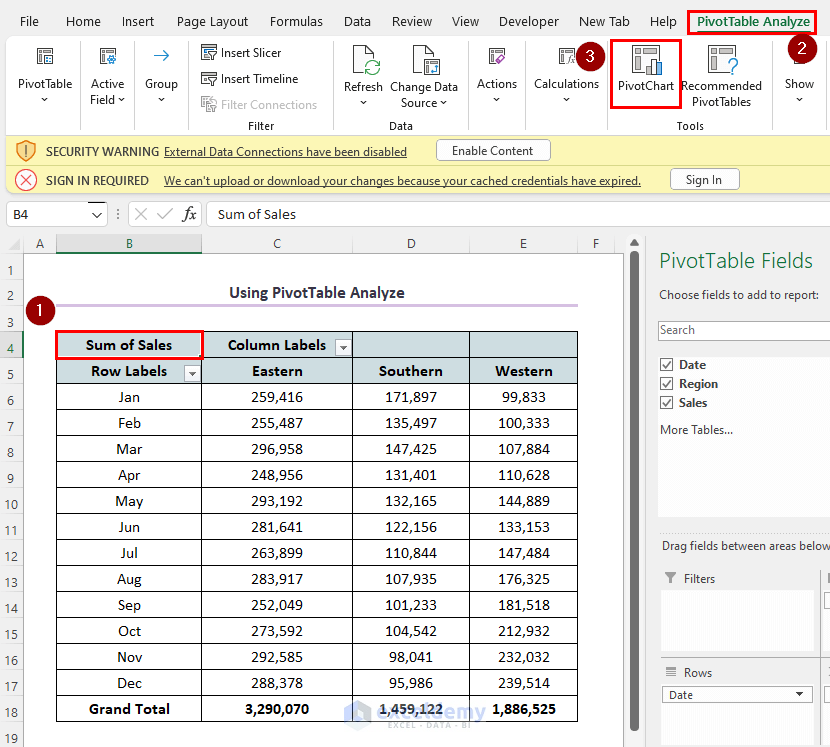
Method 1 - Inserting PivotTable We selected the cell range C5 in the Orders sheet. From the Insert tab ➪ PivotTable ➪ select From ...
Although the primary task of a pivot table is to offer different setups for analyzing data effectively, it can also create reports such as the one ...
We are going to work with a pivot table example in this section. We shall learn some useful ways to work with pivot tables. The following figure ...
The following dataset contains daily sales by region. The Date field contains the dates for the entire year excluding weekends, the Region field ...
Step 1- Creating a Pivot Table We'll use a sample dataset in cells B4:E40. Select the range of cells B4 to E40. Go to the Insert tab ...
The timeline slicer helps filter dates in the pivot table. Step 1 - Convert the Dataset into a Table Select the entire dataset to ...
Download Practice Workbook How to Use Slicer.xlsx What Is Excel Slicer? Slicer is an interactive way to Filter Excel Tables as well as ...
Excel pivot table is a fantastic tool to summarize large datasets and analyze them accordingly. When working with pivot tables, you may need to ...
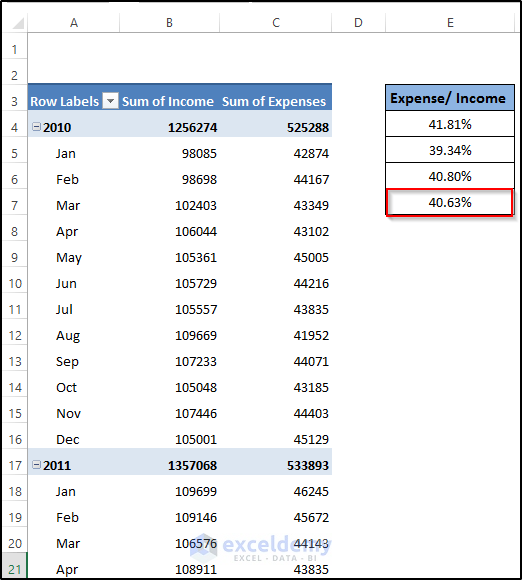
What Is a Calculated Field? A Calculated Field in a PivotTable is a custom field that you create by using a mathematical expression to perform ...
The table we'll use consists of five columns and 48 rows. Each row of the table contains the monthly sales amount for a particular sales ...
If you create more than one pivot table from the same data source, and you have created a group of items in a pivot table, this group will ...
Advanced Excel Exercises with Solutions PDF