Excel data sorting allows users to sort data according to their requirements. Data can be sorted in a variety of ways, including alphabetical order, decreasing order, partial sorting, color sorting, left-to-right sorting, and more. In this tutorial, we will illustrate some of the notable advantages of sorting data in Excel.
Advantages of Sorting Data in Excel: 5 Useful Ways
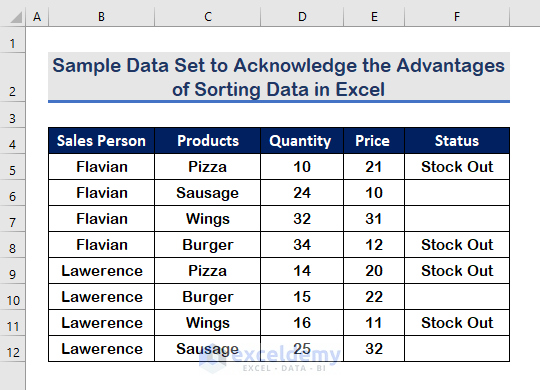
We’ve included a sample data set in the image below where we’ll use Excel’s Sort feature to describe the advantages. Sorting in Excel allows us to reorder, and show our data with better visualization based on cell values, color, or Conditional Formatting.
1. Arrange Data in a Systematic Representation
To begin, we can organize our data in a systematic manner, such as in alphabetical order (A to Z) or (Z to A) by Sort. To do so, follow the steps outlined below.
Step 1:
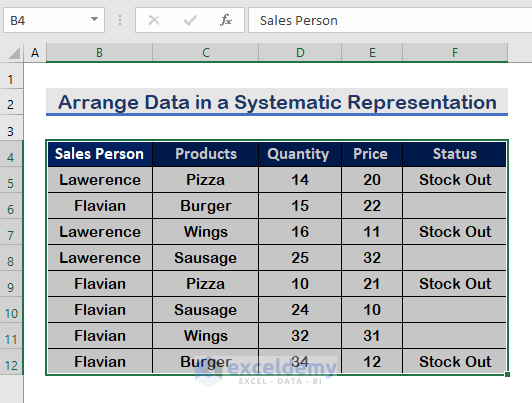
- Firstly, select the data set.
Step 2:
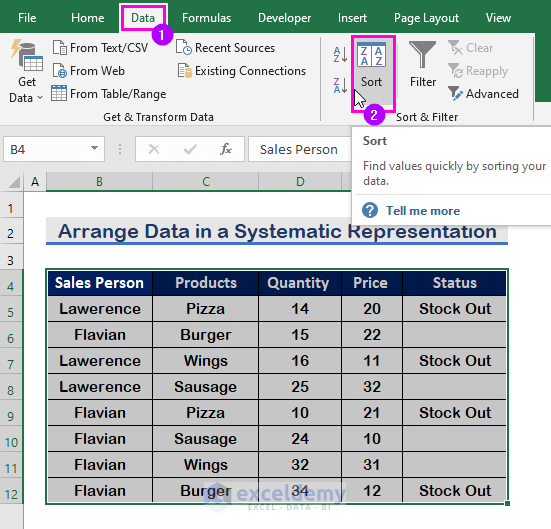
- Click on the Data tab.
- Then, select the Sort command.
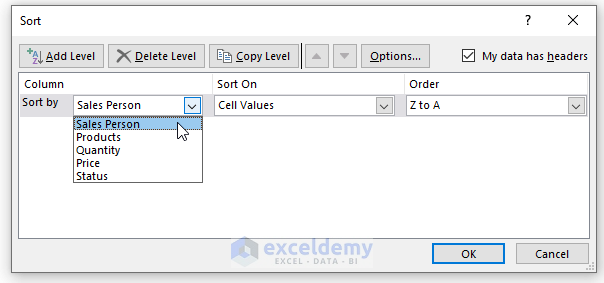
Step 3:
- From the Sort by drop-down list, select the Sales Person.
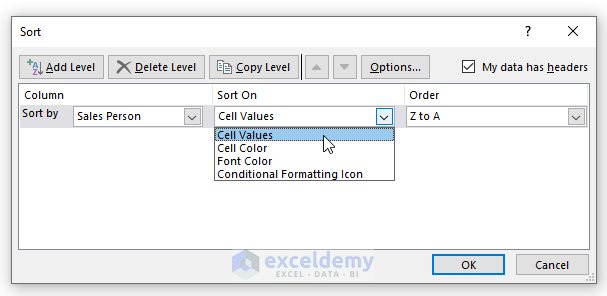
Step 4:
- In the Sort On box, select the Cell Values.
Step 5:
- Then, select the A to Z option from the Order list.
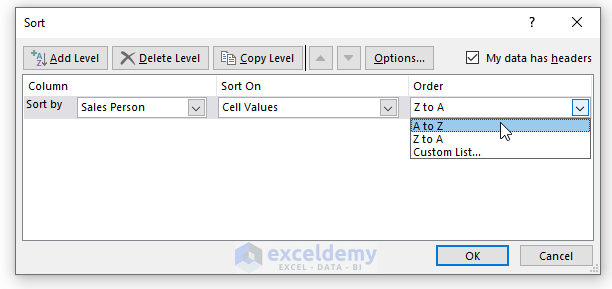
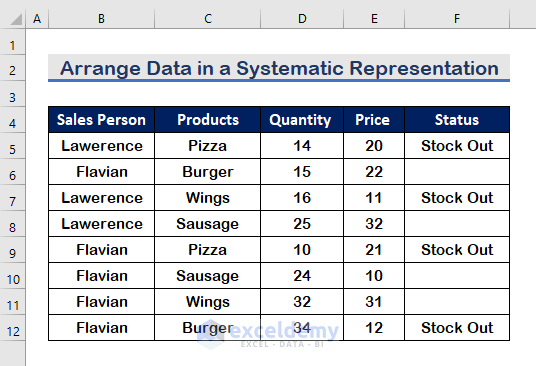
- Finally, press Enter and get the result in the image shown below.
- The Sales person’s names are rearranged in alphabetical order (A to Z).

Read More: How to Perform Custom Sort in Excel
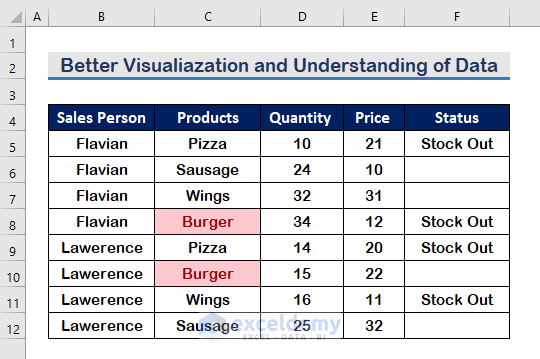
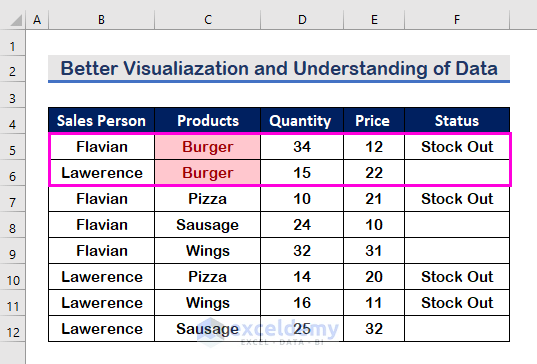
2. Better Visualization and Understanding of Data
Sorting can be used to make data more visually appealing and intelligible. In this example, we’ll use Conditional Formatting to color a product (Burger) and then sort it by color to group all Burger-related entries together.
Step 1:
- To apply Conditional Formatting in the Product column, select the column.

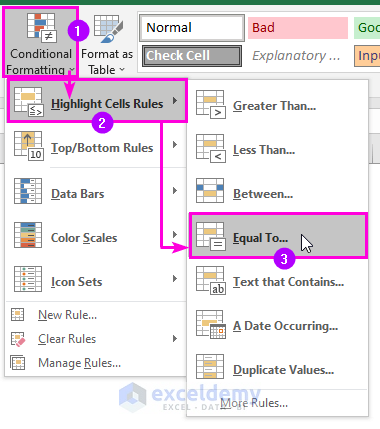
Step 2:
- From the Home tab, click on the Conditional Formating.
- Choose the Highlight Cells Rules option.
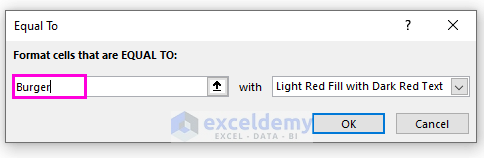
- Then, select the Equal to option from the list.
Step 3:
- Type Burger as you want to Format the cell values containing Burger.
- For cell color, select the Light Red Fill with Dark Red Text.
- Press Enter.

- As a consequence, the cell values containing Burger will appear with the applied Conditional Formatting.
Step 4:
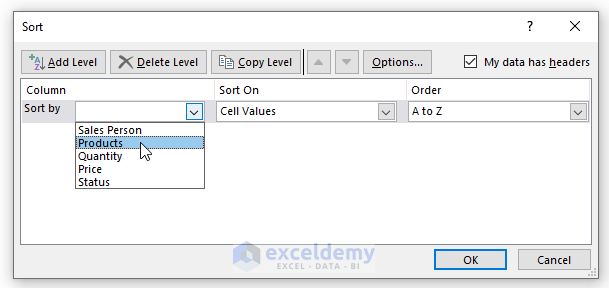
- Select the Products from the Sort by list.
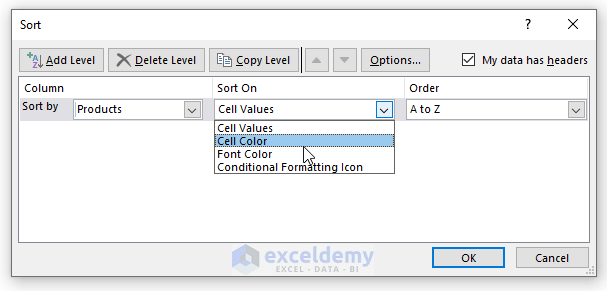
Step 5:
- To sort by color, choose the Cell Color option from the Sort On list.
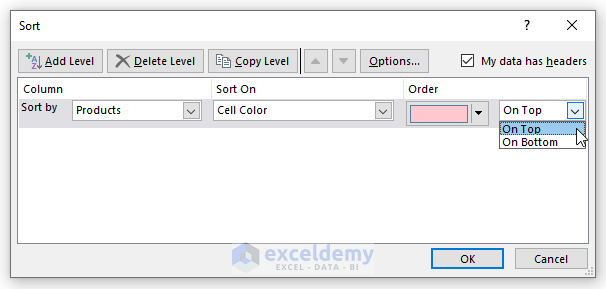
Step 6:
- Then, select the preferred color.

Step 7:
- Select On Top to show the sorting from the top in the data set.
- Finally, press Enter.
- Therefore, the cell value will be sorted as in the image shown below.
Read More: How to Perform Random Sort in Excel
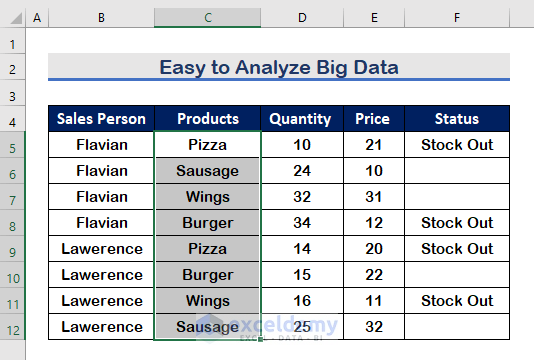
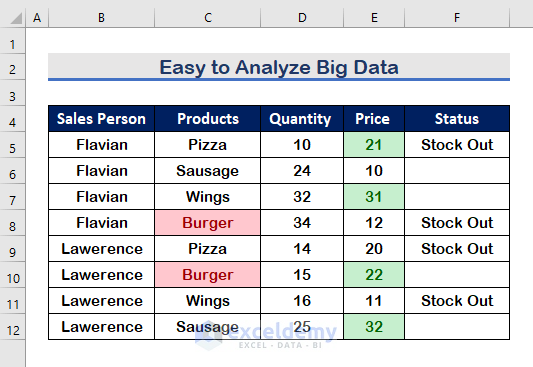
3. Advantages of Analyzing Big Data by Sorting in Excel
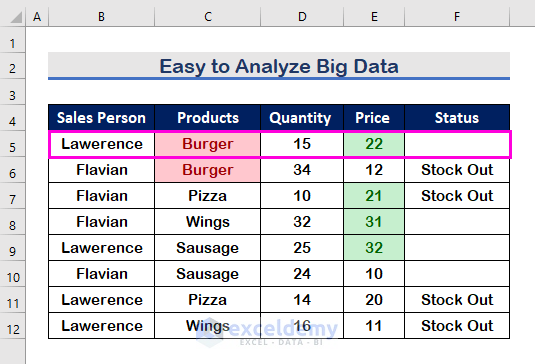
While working with big data, you may need to analyze multiple relational columns. With the help of data Sorting, you can easily achieve it. For example, you want to find the data of Burger Sold over the price of $20. So, we will apply Sorting to get the values for the requirement.
Step 1:
- Firstly, select the column Products.
Step 2:
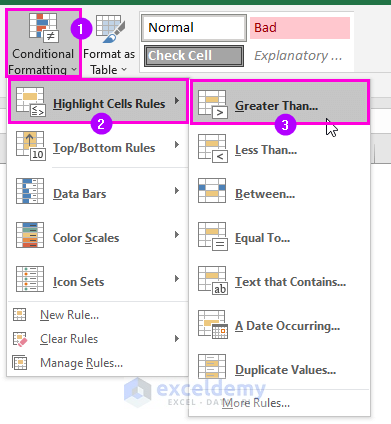
- Then, click on the Conditional Formatting.
- Select the Highlight Cell Rules option from the list.
- Finally, click on the Equal to option.

Step 3:
- Write Burger in the Format box.
- Then, select the color format Light Red Fill with Dark Text.
- Finally, press Enter.
- Consequently, it will mark the Burger with the selected color format.
Step 4:
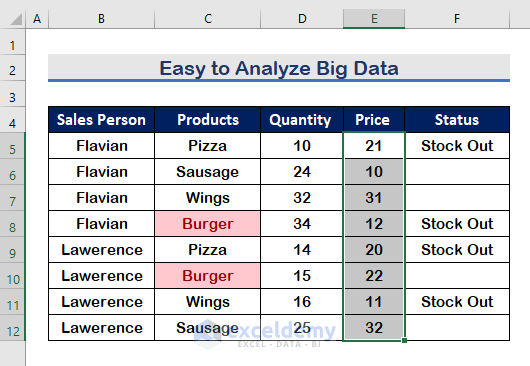
- To apply Conditional Formatting to find the values of Prices greater than $20, select the Greater Than option as the image is shown below.
Step 5:
- In the Box, type 20.
- Then, select a different color Green Fill with Dark Green Text.
- Then, press Enter.
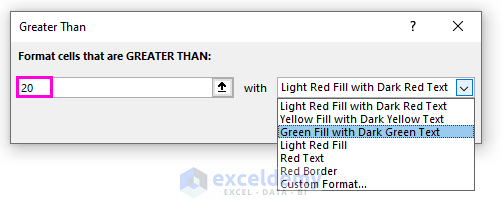
- Therefore, the Price greater than $20 is marked with Green color.
Step 6:
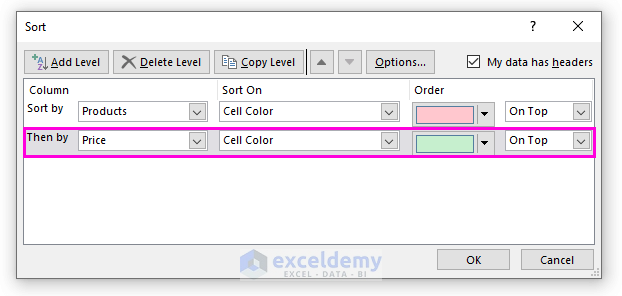
- We must apply the Sorting twice since we must sort on two criteria. The products come first, followed by the price.
- Apply Sort for the Products as shown in the image below.
- Then, click on the Add Level to add a new level.
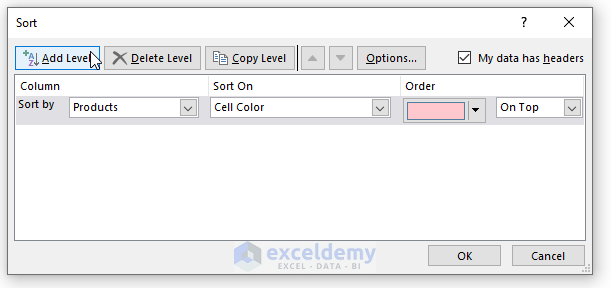
Step 7:
- In the new Level, select Price as the Sort by element.
- Choose the color as the screenshot shown below.
- Finally, press Enter.
- As a result, the value will be sorted with the condition you have applied.
Read More: How to Sort and Filter Data in Excel
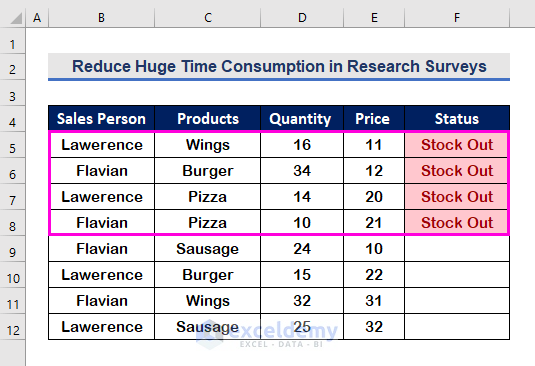
4. Reduce Huge Time Consumption in Research Surveys
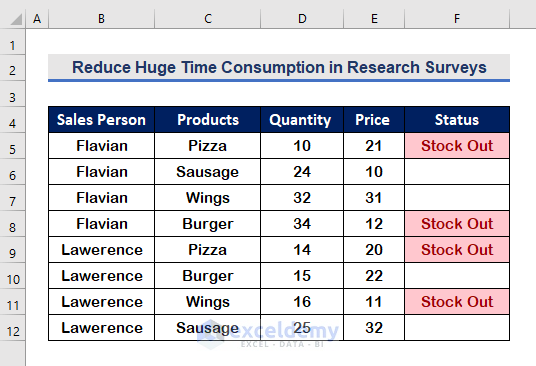
For example, you might want to extract product names for research purposes while stock is still available. If you have a large amount of data to sort, the Sort feature will suffice. At a glance, you’ll see all of the items that are currently out of stock. It will reduce lots of time consumption.
Step 1:
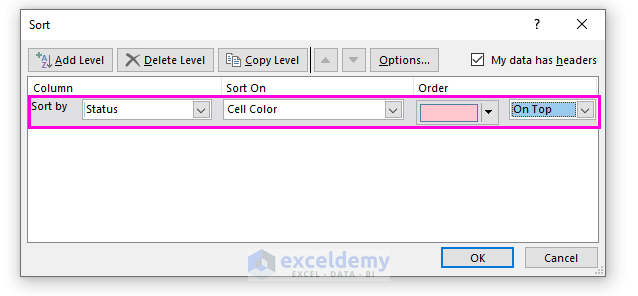
- Firstly, select Status from the Sort by list.
- Then, choose the applied color to mark the stock-out products.
- Finally, press Enter.
- Consequently, all the stock-out products will appear together.
Read More: How to Do Advanced Sorting in Excel
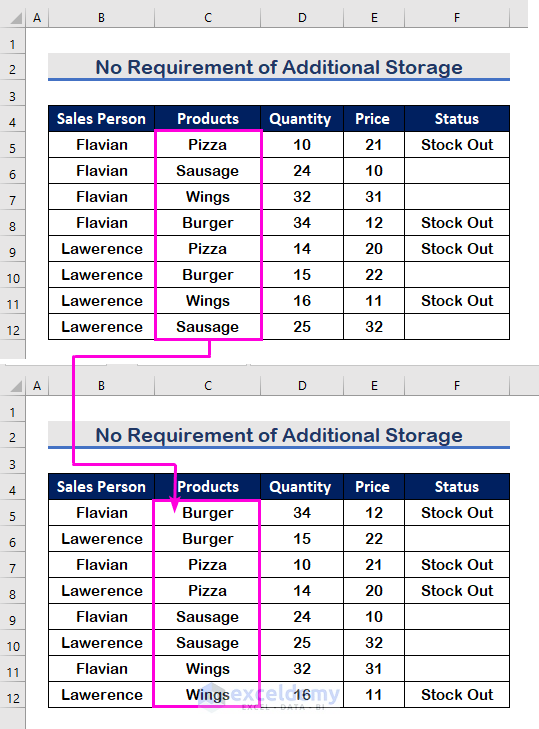
5. Advantages of No Requirement for Additional Storage by Sorting Data in Excel
When we apply the Sorting, it sorts the data in place. So, there is no need for additional storage to keep or transfer the records.
- The image below displays the sorted Products in the exact location as before.
Read More: Difference Between Sort and Filter in Excel
Download Practice Workbook
Download this practice workbook to exercise while you are reading this article.
Conclusion
To conclude, I hope this article has given you some useful advantages of sorting data in Excel. All of these procedures should be learned and applied to your dataset. Take a look at the practice workbook and put these skills to the test. We’re motivated to keep making tutorials like this because of your valuable support.
If you have any questions – Feel free to ask us. Also, feel free to leave comments in the section below.
We, the Exceldemy Team, are always responsive to your queries.
Stay with us & keep learning.
Related Articles
- How to Sort IP Address in Excel
- How to Sort Drop Down List in Excel
- How to Sort Excel Tabs in Ascending or Descending Order
<< Go Back to Sort in Excel | Learn Excel
Get FREE Advanced Excel Exercises with Solutions!
