Excel Statistical Comparison of Two Data Sets Introduction
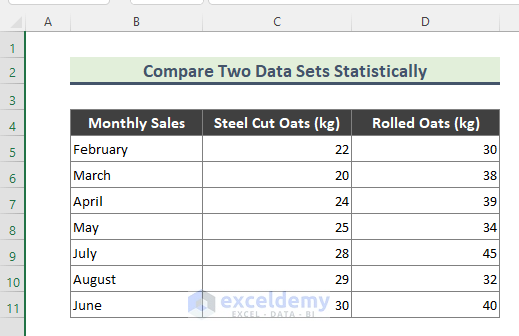
We will use two monthly sales datasets of Steel-cut oats and Rolled oats. We will determine how sales of these two types of oats change over time. We will find the Mean, Standard Deviation, Coefficient of Variation, and Range for Steel-cut oats in the range (C5:C11).
Steps:
- To get the Mean of Steel cut oats, use the following formula in Cell C12.
=AVERAGE(C5:C11)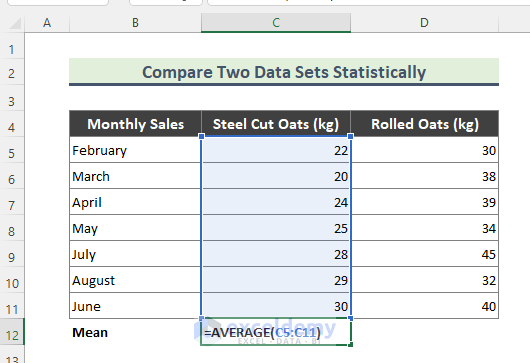
- To determine the standard deviation of dataset C5:C11, use the following formula in Cell C13.
=STDEV.S(C5:C11)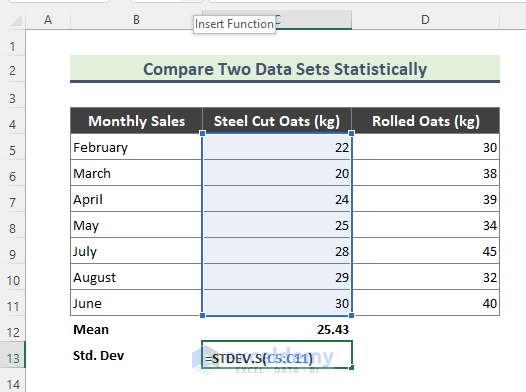
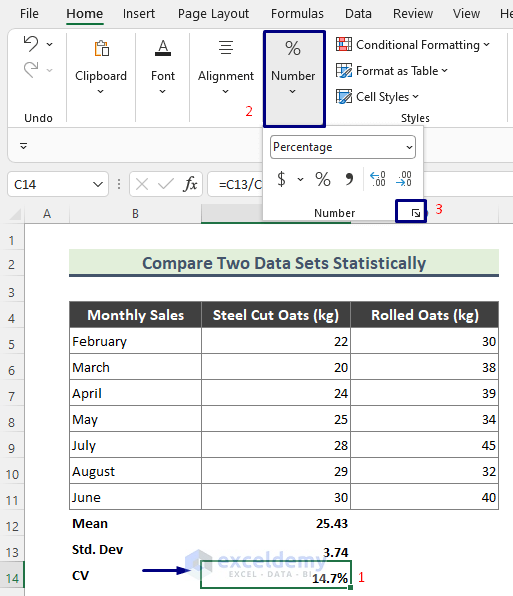
- To calculate the Coefficient of Variation of the dataset (C5:C11), use the following formula to get the Steel-cut oats’ sales:
=C13/C12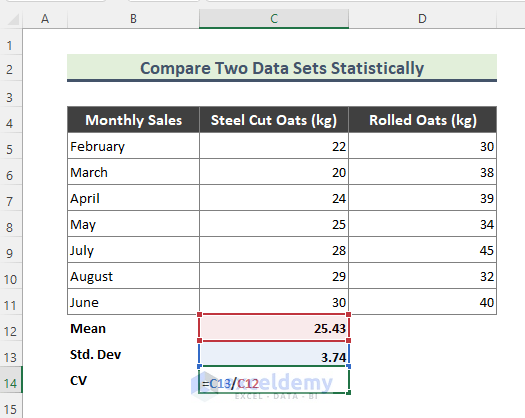
- Select the corresponding cell (C14), then go to Home and select Number.

- Try to keep the value with 1 decimal place and hit OK.
- To calculate the range of the data set (C5:C11), use the following:
=MAX(C5:C11)-MIN(C5:C11)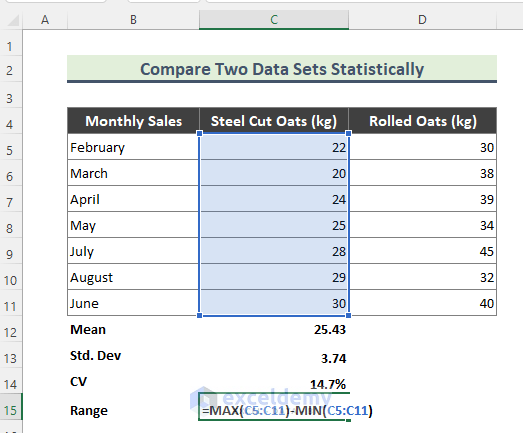
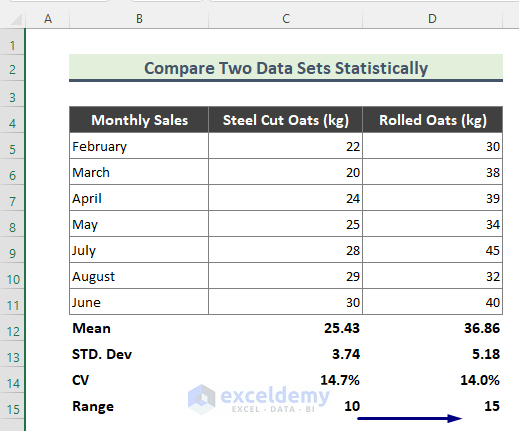
- Dag down the Fill Handle (+) tool to copy all the formulas to calculate the Mean, STD Deviation, CV, and Range of the Rolled oats dataset.
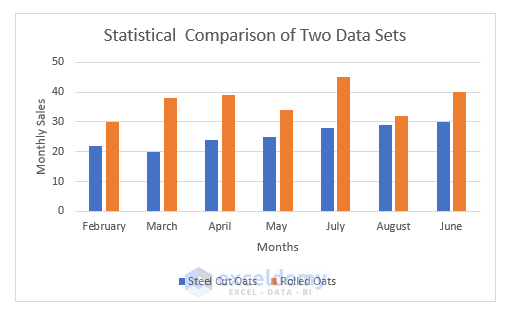
Statistical Comparison Between Data Sets in Excel
We’ll compare the datasets.
Mean: Mean is the arithmetic average of a dataset. And, from the above calculation, we can see that Rolled oat’s sales Mean is greater than that of the Steel cut one’s. That means, over time, the sales of Rolled oats are greater than the other one.
Standard Deviation: The standard deviation is a measure of the amount of variation of data points or values relative to their average or mean. For example, a low standard deviation tells us that the values tend to be close to the mean of the dataset. On the other hand, a high standard deviation means that the values are spread out over a wider range. Here, from our result standard deviation is greater for Rolled oats. Thus, this indicates the sales values of Rolled oats are spread out over a wider range than those of the Steel-cut oats.
CV: The coefficient of variation (CV) is a relative measure of variability that indicates the size of a standard deviation to its mean. From our above calculation, we can see that the CV of Steel cut oats is slightly higher than that of Rolled oats. Consequently, we can summarize that sales values of Rolled oats are more consistent compared to Steel-cut ones.
Range: In statistics, the range of a set of data is the difference between the largest and smallest values. It is evident from the datasets that Rolled oats have a higher range. This result indicates that, for some months, fluctuation of the sales of Rolled oats is higher than those of the Steel cut ones.
Download the Practice Workbook
<< Go Back to Columns | Compare | Learn Excel
Get FREE Advanced Excel Exercises with Solutions!
