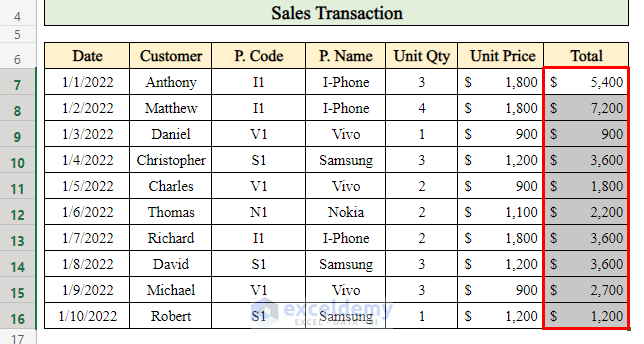
Dataset Overview
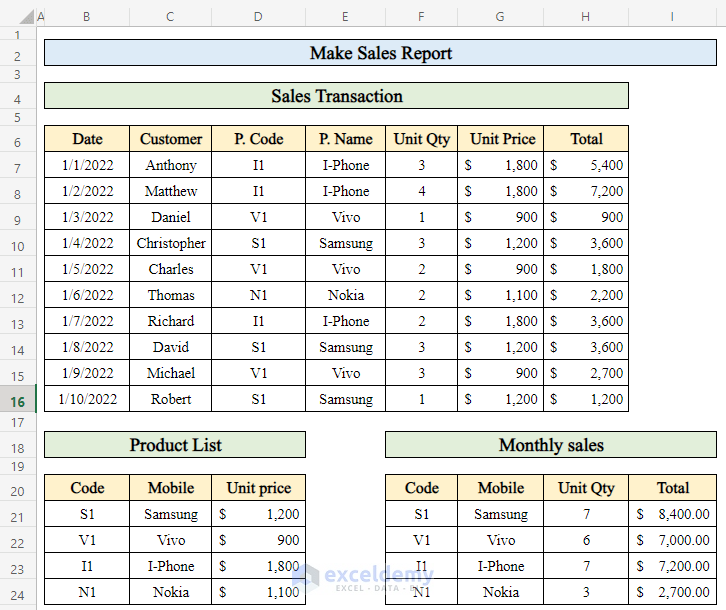
Let’s create a sales report for a mobile shop by using three different datasets as shown below:
Step 1 – Retrieve Product Name from the Product List
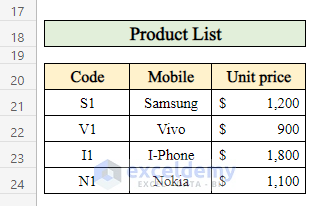
- Work with a dataset that contains a list of products along with their Product Codes, Names, and Unit Prices.
- The goal is to calculate daily sales based on this data.
- Additionally, there’s another data table for calculating total sales over the entire month.
- Collect data from the daily sales transaction table to determine the total monthly sales.
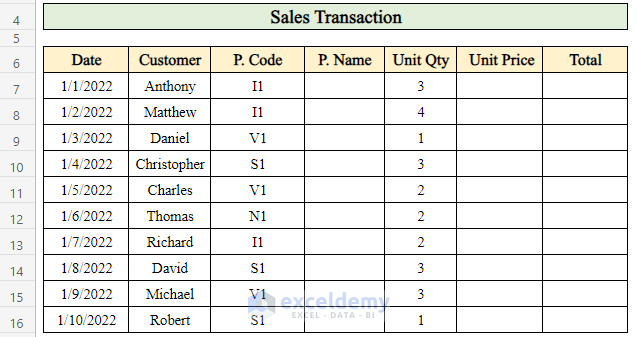
- To find the product name for a specific day:
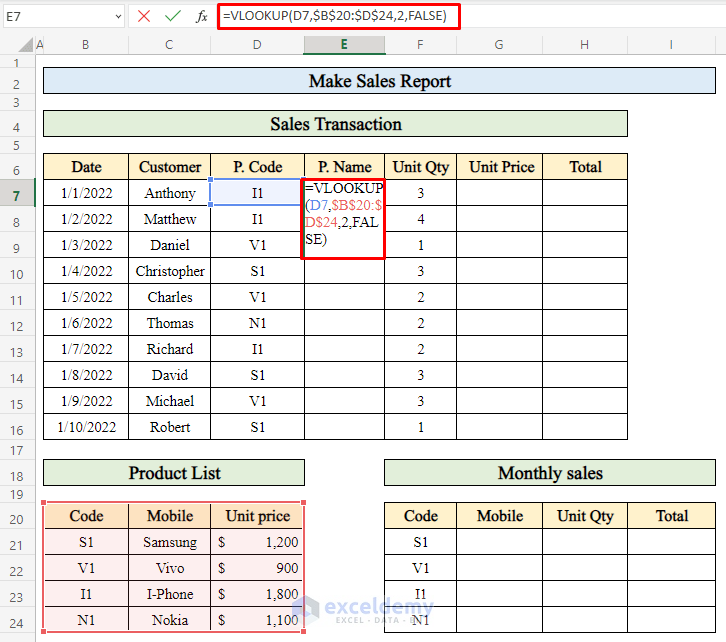
- Select cell E7 where you want to apply the formula.
- Enter the following formula:
=VLOOKUP(D7,$B$20:$D$24,2,FALSE)-
- The VLOOKUP function searches for the product code in a column and returns the corresponding product name.
- Press Enter to calculate the product name for that day.
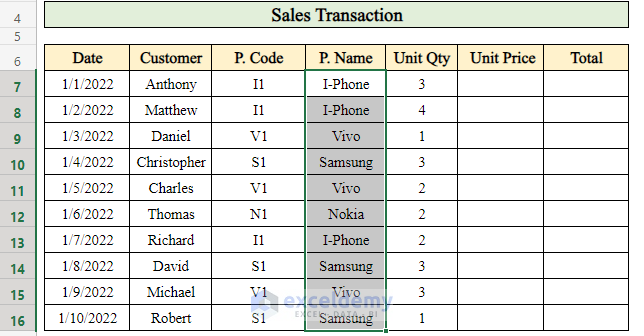
- Drag down the Fill handle to populate the results in all the cells.
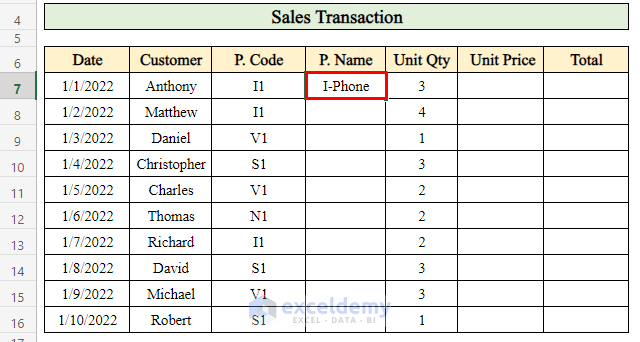
This way, you can retrieve the names of all products sold on a particular day using the VLOOKUP formula.
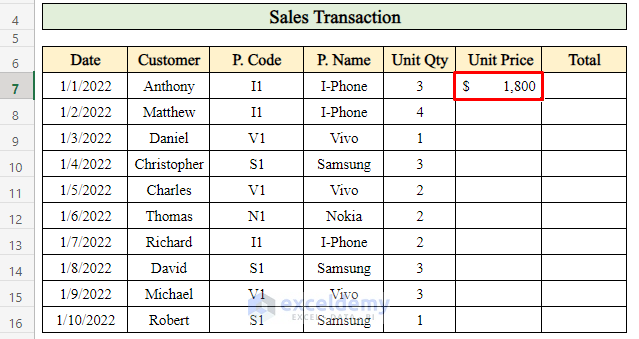
Step 2 – Determine Unit Prices in the Sales Report
- To calculate the unit price for each product:
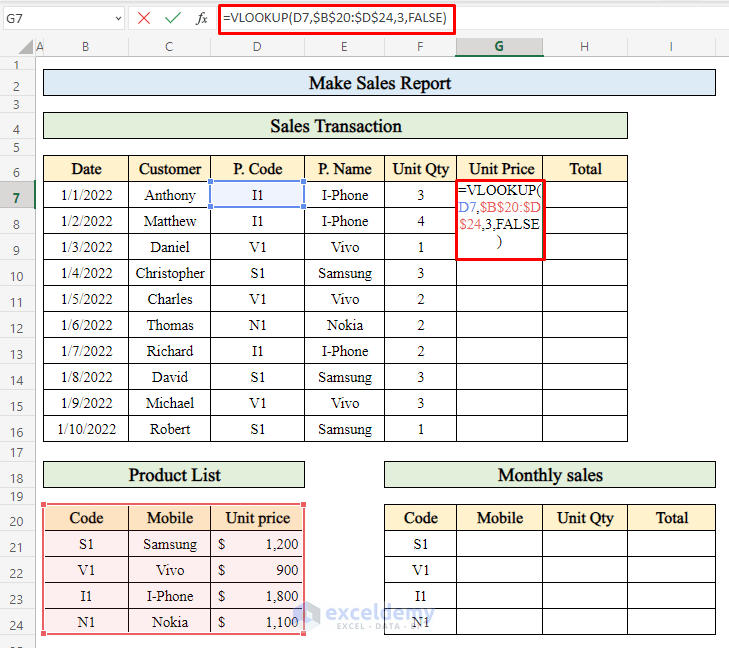
- Select cell G7.
- Apply the following formula:
=VLOOKUP(D7,$B$20:$D$24,3,FALSE)
-
- This formula retrieves the unit price associated with the product code.
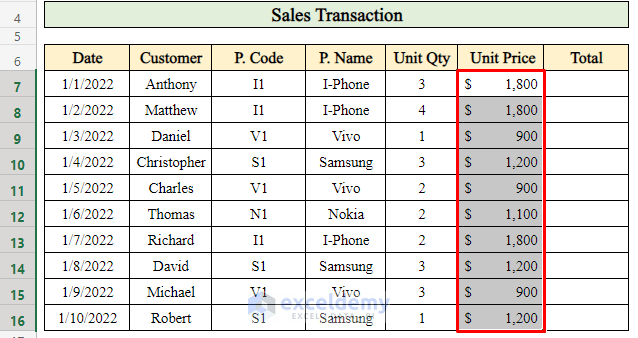
- Press Enter to complete the calculation.
- Drag down the Fill handle to copy the formula and get the unit prices for all products.
Now you have the unit prices for each product sold every day.
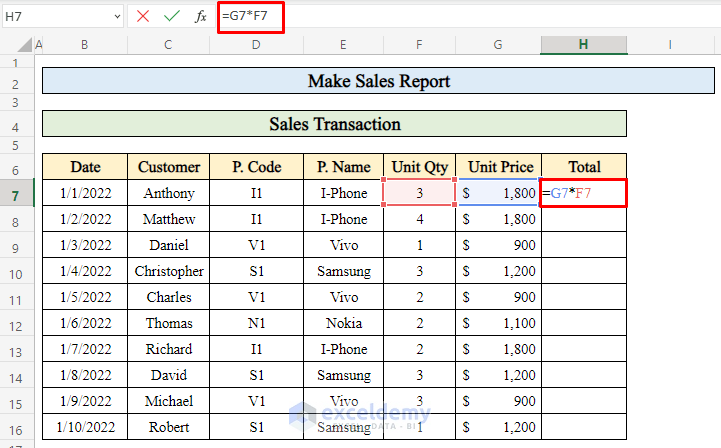
Step 3 – Calculate Total Sales for the Day
- To find the total sales for a single day:
- Select cell H7.
- Use the formula:
=G7*F7-
- Multiply the unit price (G7) by the quantity sold (F7).
- Press Enter to get the total sales for that day.
- Drag down the Fill handle to extend the calculation for other dates.
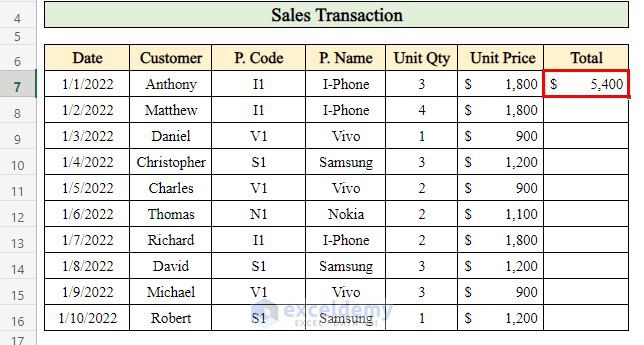
As a result, you’ll have the total sales for each day, which can be useful for daily reporting.
Read More: Create a Report That Displays Quarterly Sales in Excel
Step 4 – Compute Monthly Sales for a Single Product in Excel
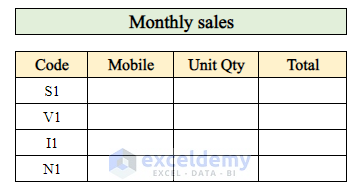
- To get an overview of the sales report, follow these steps:
- Select cell G21 (where you want to display the product names for the month).
- Enter the formula:
=VLOOKUP(F21,$B$20:$D$24,2,FALSE)
-
- This formula retrieves the product name based on the product code in cell F21.
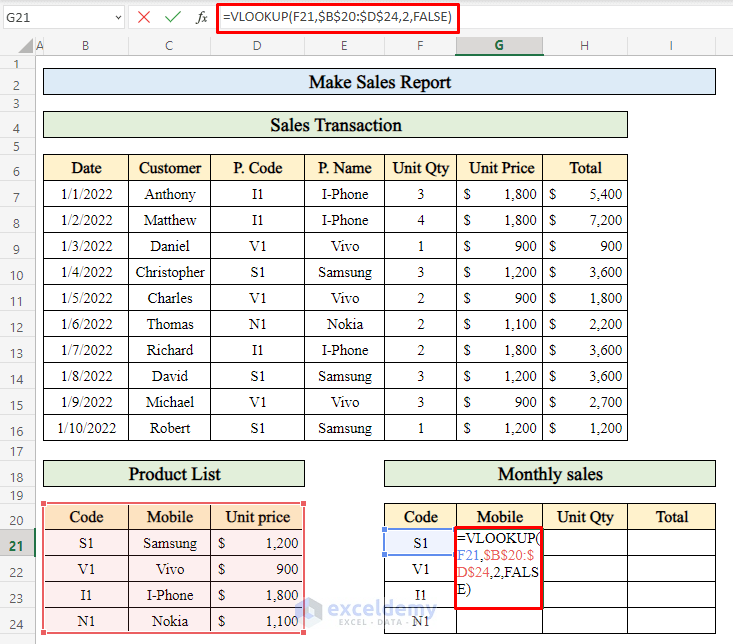
- Press Enter to display the product name.
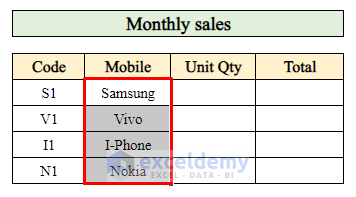
- Drag down the Fill handle to populate the product names for the entire month.
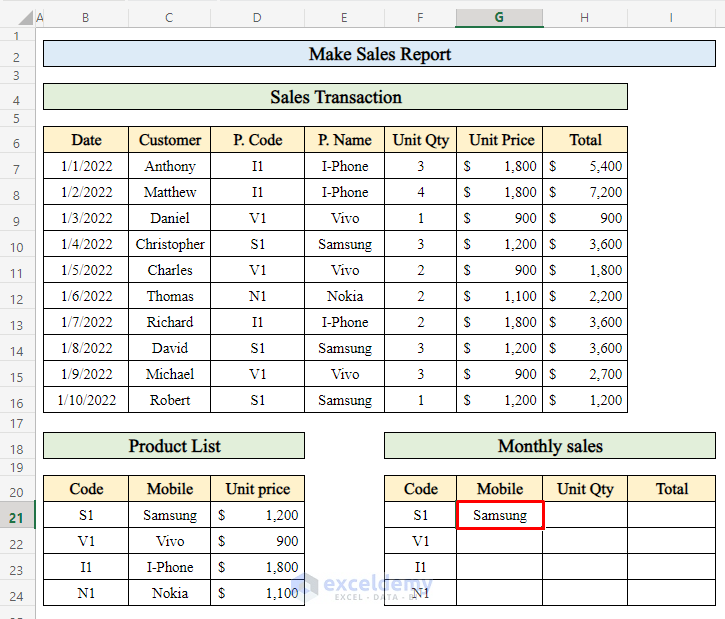
And there you have it! You’ve calculated the monthly sales for a single product in Excel.
Step 5 – Calculate the Total Quantity of Products Sold
- To determine the total quantity of products sold in the month, follow these steps:
- Select cell H21 (where you want to display the total quantity).
- Enter the following formula:
=SUMIF($D$7:$D$16,F21,F7:F16)-
- The SUMIF function adds up the values in the range F7:F16 that correspond to the product code in cell F21.
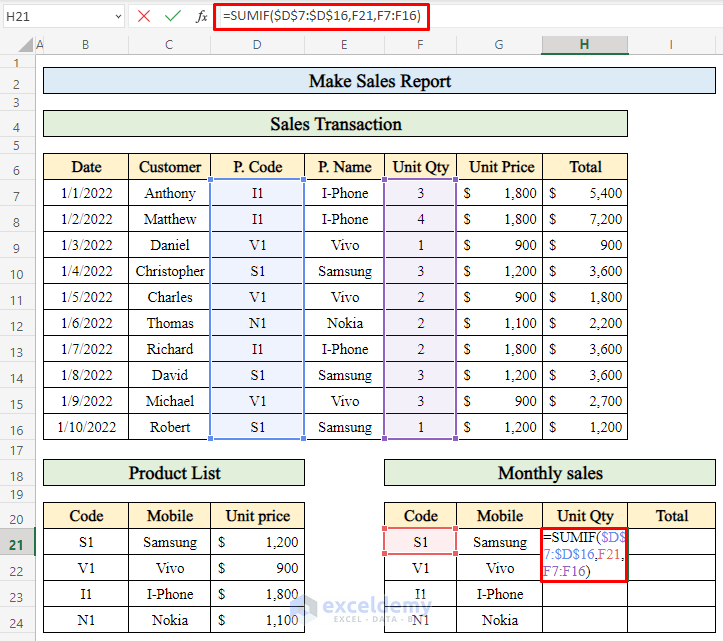
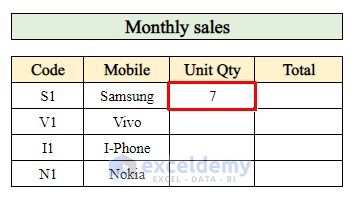
- Press Enter to calculate the total quantity sold for that product.
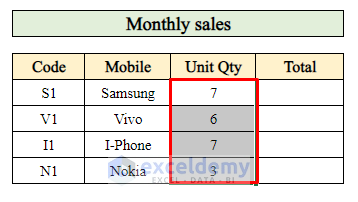
- Drag down the Fill Handle to extend the calculation for other products.
Now you have the total quantity sold for each product in the month.
Read More: Create a Report that Displays the Quarterly Sales by Territory
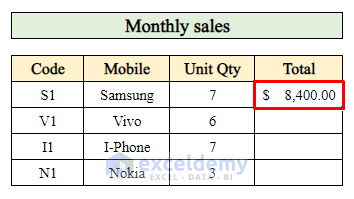
Step 6 – Calculate Total Sales to Complete the Sales Report
- Let’s calculate the total sales amount for the entire month:
- Select cell I21 (where you want to display the total sales).
- Apply the following formula:
=SUMIF($D$7:$D$16,F21,H7:H16)-
- This formula sums up the sales amounts (in column H) for the product code in cell F21.
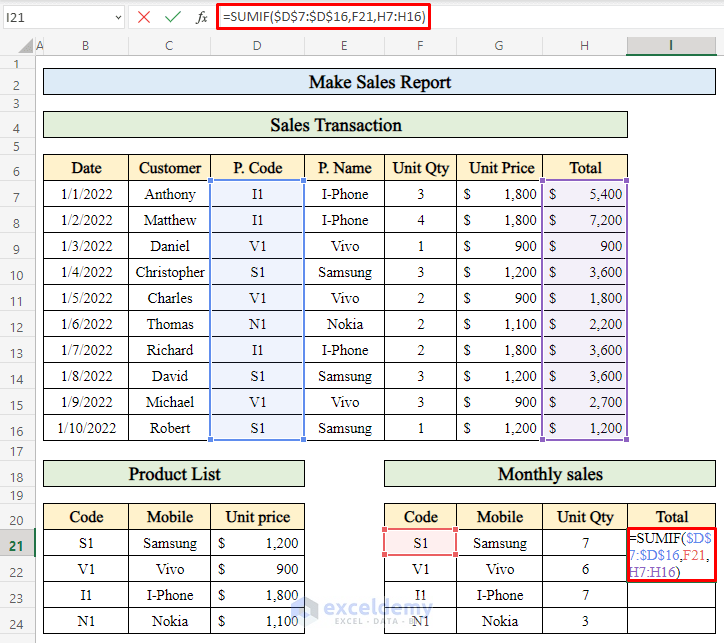
- Press Enter to get the total sales amount.
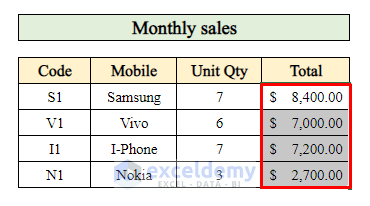
- Drag down the Fill handle to populate the total sales for other products.
You’ve successfully completed your sales report, including both the total quantity sold and the total sales amount for the month.
Read More: How to Make MIS Report in Excel for Sales
Things to Remember
- Handling #N/A Errors:
- Occasionally, you might encounter an #N/A error when using the VLOOKUP formula. This error occurs when the formula cannot find the value it has been asked to look up.
- Double-check your data and ensure that the lookup value exists in the specified range. If not, the formula will return #N/A.
- Lookup Direction:
- The VLOOKUP function always searches for values from left to right. Keep this in mind when organizing your dataset.
- Place the lookup value (the value you want to find) in the leftmost column of your data range. This ensures accurate lookups.
- Using Absolute References ($) for Cell Ranges:
- When defining cell ranges in your formulas, use absolute references (indicated by the $ symbol) to keep the range fixed.
- Absolute references prevent the range from changing when you copy the formula to other cells.
Download Practice Workbook
You can download the practice workbook from here:
Related Articles
- How to Prepare MIS Report in Excel
- How to Make MIS Report in Excel for Accounts
- How to Make Monthly Sales Report in Excel
- How to Make Daily Sales Report in Excel
<< Go Back to Report in Excel | Learn Excel
Get FREE Advanced Excel Exercises with Solutions!

Great post! I found the step-by-step guide really helpful, especially the tips on using formulas to automate calculations. Can’t wait to implement this for my next sales report!
Hello Dear,
Thanks for your appreciation. We are glad to hear that out step-by-step guide is helpful to you. You can use our guide to create a sales report. Keep learning Excel with ExcelDemy!
Regards
ExcelDemy